Quantcast
Channel: Infragistics Community
Viewing all 2372 articles
Browse latest View live

Getting started with the Ignite UI igTree in three simple steps

$
0
0

Trees are some of the most important controls used to build modern web applications. HTML does not provide any tree elements out of the box, but by using the Ignite UI library by Infragistics, you can very easily create a tree control in your application – simply use the Ignite UI tree control, igTree. In this post, we will show you how to get started with this control in three simple steps. Let’s get started!

Step1: Adding References

To work with any IgniteUI control, first we need to add the required JavaScript and CSS references. So, let us start with that. We have two options to add references:

  1. Download IgniteUI and add the required files to your project, referencing local IgniteUI files from the project.
  2. Via CDN: the Ignite UI team provides a public CDN to use.

In this example I am going to use the Ignite UI CDN. So we can add references as shown in the listing below:

< head>< title>igTree demo< linkhref="http://cdn-na.infragistics.com/igniteui/2016.1/latest/css/themes/infragistics/infragistics.theme.css"rel="stylesheet"/><linkhref="http://cdn-na.infragistics.com/igniteui/2016.1/latest/css/structure/infragistics.css"rel="stylesheet"/><scriptsrc="http://ajax.aspnetcdn.com/ajax/modernizr/modernizr-2.8.3.js"><scriptsrc="http://code.jquery.com/jquery-1.9.1.min.js"><scriptsrc="http://code.jquery.com/ui/1.10.3/jquery-ui.min.js"><scriptsrc="http://cdn-na.infragistics.com/igniteui/2016.1/latest/js/infragistics.core.js"><scriptsrc="http://cdn-na.infragistics.com/igniteui/2016.1/latest/js/infragistics.dv.js"><scriptsrc="http://cdn-na.infragistics.com/igniteui/2016.1/latest/js/infragistics.lob.js"><scriptsrc="demo.js">

Essentially we are adding references of

  • Ignite UI CSS libraries
  • jQuery library
  • jQuery UI library
  • Ignite UI core, dev, and lob libraries.

Keep in mind that you need to follow the same sequence of adding references as shown in the above listing. You may notice that I have also added a reference to the demo.js file. As a starter, demo.js contains a function as shown in the listing below. We will write all the required JavaScript codes inside this function.

$(function () {


});

Step 2: Creating Data

We can bind data from different sources, in either of the following forms:

  • XML data
  • JSON data

Let us start with creating LOCAL JSON data to bind to igTree. In this example we are creating foodsData, which has three fields: ID, Type, and Items.

var foodsData = [
        {'ID':1,'Type':'Drinks','Items': [
            {'name':'Pepsi'
            },
            {'name':'Sprite'
            },
            {'name':'Sprite'
            },]
        },
         {'ID':2,'Type':'Food','Items': [
                 {'name':'Burger'
                 },
                 {'name':'Bread'
                 },
                 {'name':'Taco'
                 }, ]
         },
         {'ID':3,'Type':'Salad','Items': []
         }

    ]

In a real application, most of the time, data will be fetched from the server. So the server will have a REST API, and before binding JSON data from the REST API, we will have to create the Ignite UI data source, which can also be created for the local data too.  We can create an Ignite UI data source for the foodsData JSON array as shown in the listing below:

var ds =new $.ig.DataSource({
        type:"json",
        dataSource: foodsData
    });
    ds.dataBind();

Step 3: Creating Tree

So far, we have added the references and created the data to be bound. Now a igTree can be created in two steps:

  1. Create a ul element
  2. Convert the ul element to igTree and set the data source

We have the ul element in HTML as shown in the listing below:

<ulid="countryTree"></u l>

In the second step, we need to convert the HTML ul element to the igTree and set its data source and binding. We can set data source directly to JSON data or igDataSource. We have already created a data source in the previous step, so let us use that as the dataSource of igTree, and create the igTree as shown in the listing below:

$("#countryTree").igTree({
        dataSource: ds,
        bindings: {
            textKey:"Type",
            valueKey:"ID",
            childDataProperty:"Items",
            bindings: {
                textKey:"name",
            }
        }
    });

If you take a closer look, you’ll see that we’ve set the binding properties to the different fields of the JSON data. For example, textKey is set to Type field, valyeKey to the ID, and so on. At this point, when running the application, you will find the igTree generated with the local JSON data.

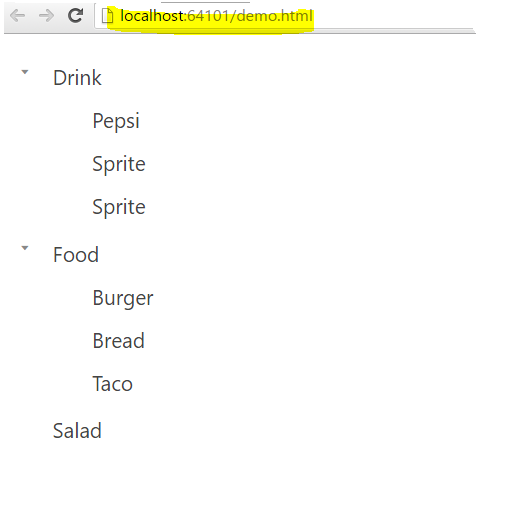
Here the Salad node is empty because there are no items in it. For the other nodes, sub items are bound using the Items field of the data source.

So there we have it: we’ve created a tree! Now you may want to click on one of the nodes to select them. To do that, there are many events exposed on igTree.  However, to select a particular item, you need to handle nodeClick event of the igTree. A particular node item’s name can be selected using the ui.node.data.name

nodeClick:function (evt,ui) {
            console.log(ui.owner);
            console.log(ui.node);
            console.log(ui.node.data.name);
        }

Putting it all together

To see the full picture, let us put every piece of code together. To create the igTree, the HTML will contain references and just one ul element. In the JavaScript, we are creating the data source and then using the selector creating igTree. The complete JavaScript file will look like this:

$(function () {var foodsData = [
        {'ID':1,'Type':'Drink','Items': [
            {'name':'Pepsi'
            },
            {'name':'Sprite'
            },
            {'name':'Sprite'
            },]
        },
         {'ID':2,'Type':'Food','Items': [
                 {'name':'Burger'
                 },
                 {'name':'Bread'
                 },
                 {'name':'Taco'
                 }, ]
         },
         {'ID':3,'Type':'Salad','Items': []
         }

    ]

    var ds =new $.ig.DataSource({
        type:"json",
        dataSource: foodsData
    });
    ds.dataBind();

    $("#countryTree").igTree({
        dataSource: ds,
        bindings: {
            textKey:"Type",
            valueKey:"ID",
            childDataProperty:"Items",
            bindings: {
                textKey:"name",
            }
        },
        nodeClick:function (evt,ui) {
            console.log(ui.owner);
            console.log(ui.node);
            console.log(ui.node.data.name);
        }
    });
});

Conclusion

There you have it: the beginnings of working with the igTree! Keep an eye out for future posts where we’ll focus on other features. Thanks for reading!


Ready for Launch?

$
0
0

SpaceX

Space exploration is humanity's ultimate design challenge. To start, some fundamental laws of physics must be overcome in order to escape Earth's gravitational pull. Then, a life sustaining environment must be created in the inhospitable vacuum of space. This seemingly impossible goal was achieved during the space race of the 50's and 60's, but rockets designed for sustainable space exploration have only recently seen significant improvement.

Last month, SpaceX successfully launched their Falcon 9 rocket, transporting a commercial, communications satellite into low-earth orbit, and landed the rocket safely on a drone ship. This is one of many missions that will incorporate reusable, self-landing rockets. While the engineers at SpaceX made this miracle of physics look easy, it was a long road of trial, and especially error (two and a half years and three consecutive failed launches), that ultimately lead to the company's success.

SpaceX founder Elon Musk has compared the challenge of building a rocket to his experience in software engineering:

"The best analogy for rocket engineering is if you wanted to create a really complicated bit of software. You can't run the software as an integrated whole, you can't run it on the computer it's intended to run on, but the first time you put it all together and run it on that computer it must run with no bugs."

This leads to an interesting comparison to the UX Design work that I do. While designing a software application may not be as daunting a task as building a rocket (or even coding a software application), there are still challenges that cause projects to fall short of perfection. 

Functionality-Centered Design Challenge

Many of us are familiar with typical business software that attempts to improve efficiency, but ultimately produces a tangled knot of functionality. This reoccurring pattern stems from the impulse to simply gather all the necessary functionality in one place, hoping a positive user experience will emerge once it is rolled out. The resulting user experience is one that is function-centric rather than user-centric, and typically results in an unintuitive “toolbox”. As a result, companies end up wasting time and money on training as users are forced to adapt to a poorly designed application.

People are expected to adapt because they have no other choice. On the other hand, rockets don’t adapt to poor design – they explode. Rockets are treated with respect. People are treated with contempt – if they are considered at all.

Design Solution

The design process we follow identifies the needs of the user population and uses this information to guide the decisions necessary to craft useful and usable applications. When a design challenge is approached from a focus on these fundamentals, an organic solution emerges that coordinates functional requirements with user needs. The result is an application that is pre-adapted to meet the needs of those that will use it.

The success of business software product launches is determined by metrics like user adoption and productivity. When a launch fails, companies typically rely on training and managerial mandates to bridge the gap between user needs and software design. When designing for a launch that ultimately has to overcome the force of gravity, no gaps can be left. Hard science reveals a rigid set of nonnegotiable requirements that must be met 100% of the time in order for the product to be considered “successful”.

This is a lesson the software industry needs to take to heart. As a species, we are all designing a small piece of the future, and like the space industry, we should strive for perfection. While it’s true that we are not usually tackling projects of interstellar magnitude or dealing with requirements fixed like laws of nature, we cannot rely on users to make up for shortcomings in our designs. Sure, we can take comfort in the fact that our projects are unlikely to literally crash and burn on live television, but that’s a small comfort when millions are spent on software that no one wants to use.

About the SwfConfig File

$
0
0
The most common problems when working with Infragistics IG TestAutomation, formerly TestAdvantage, is either directly or indirectly related to the swfconfig.xml file. So what is this file, what does it do?  

What is the SwfConfig file?

The SwfConfig file, or .NET Add-in Extensibility configuration file as it is sometimes referred to by HP, is a XML formatted configuration file. This file is always located at the location:

{$HPTestingSoftwareInstallDirectory}\dat\SwfConfig.xml

This configuration file is read by HP’s UI testing software whenever you create a new or open a different existing test. This file is used to map the UI controls that you interact with for recording and replaying automated tests to a custom server proxy, such as what IG TestAutomation does for Infragistics Windows Forms UI controls.

What Information does the SwfConfig file Contain?

HP UI testing software loads this XML file into an internal table every time you either you create a new script or open an existing one. This timing should be noted, on one hand it offers the user the ability to change the SwfConfig file without closing the testing software, but on the other changes to the file do not take effect if you don’t change the active script. Also the configuration is not tied to a script, an existing script can be working fine, but changes to the SwfConfig file can break the script, even though the script itself wasn’t changed.

The above mentioned table maps the text Type name of a .NET UI Control that inherits from System.Windows.Forms.Control to the DLL’s and classes that are intended to control the record functionality, the replay functionality, and an interface that tells the testing software what methods are intended to be public. In addition Settings specific to the proxy can me stored as parameters, those about are exposed via the Settings Utility entry that correspond to the control as well as in a script.

How does the SwfConfig file work?

During Record

HP listens to low level windows messages to determine which control you are attempting to interact with. In the case of keyboard interaction, it bases off what Control has keyboard focus, in the case of Mouse interactions it bases it off of if you Clicked or moved inside the bounds of that control. When testing software identifies a control it first checks the Object Repository to see if it has already interacted with the control. It then looks up the Type name of the control in the SwfConfig based table. If the software finds the Type name in the table, and if the DLL referenced in the CustomRecord tag is not already loaded, the software will then attempt to load the DLL.

NOTE: While the UI Testing software can responds to mouse hovers, mouse moves and similar indirect actions. Those indirect action will not cause it to trigger an initial load of a custom server proxy, only a Click, gain focus, or keyboard input will trigger the initial load.

During Replay

Each line of script references one or more objects in the Object Repository. Internal to the Object Repository it stores the type name, and when you run the line of script, it will look up the type name in the SwfConfig based table. If the software finds the Type name in the table, and if the DLL referenced in the CustomReplay tag is not already loaded, the software will then attempt to load the DLL.

Troubleshooting

As the primary use of the SwfConfig file is to match the UI control under test with the custom proxy server DLL associated with it, and since that DLL contain all the record and replay functionality for that control, any issue with the SwfConfig will in turn break all of the custom record and replay functionality for that control.  

The symptoms of issues with the SwfConfig.xml vary depending on the root cause, and the timing of when you are getting those symptoms either via record or replay. The resolutions will vary depending on the symptoms.

During Record

In many cases, you can identify an issue with the SwfConfig file, when recording against an Infragistics control, in the recorded script line the objects are proceeded with Swf, such as SwfObject or SwfTable, but the action recorded is Click #,# representing X and Y coordinates or Type “string value”.

It should be noted that it is possible that the HP UI testing software may record actions other than Click X, Y or Type “string” and still be a problem with the SwfConfig file. This is because they have implemented some functionality for Infragistics controls. The functionality that was implemented was done based on a limited subset of our controls at the time of their implementation. The controls and feature sets that have support are roughly based on the controls we had a the time of their implementation of the support, which is approximately the NetAdvantage 2005 volume 1 version of the controls.

When IG TestAutomation was first created its initial implementation was based on the support already provided, so the actions that might be recorded would be similar to actions recorded by TestAdvantage, but likely the actions recorded will be limited and not replay as intended as the NetAdvantage controls have changed over the years.

By the nature of how the HP UI testing software handles recording, you will very rarely get a discernable error, as they regularly swallow all errors.


During Replay

Typically the only way you will tell you have an issue from Replay is from a previously successfully recorded script. As an improperly configured SwfConfig file means you wouldn’t be able to record either, means you are likely testing an existing script, such as those that come with the samples.

Some of the most common issues that you will get during replay are via one of the following exceptions.

This happens when the version of TestAdvantage doesn’t match the version of NetAdvantage that you are using for the UI control in the application under test (AUT). The nature of the exception is TestAdvantage has references to NetAdvantage assemblies, but of a difference version than is included in the AUT. It attempts to find it, which in normal circumstances it would load it from the AUT, but as they are different it is unable to find the assembly it needs.


2.       Throws a ‘Cannot cast exception’ exception, and the same named assembly but from two different versions.

Similarly this also happens when the version of TestAdvantage doesn’t match the version of NetAdvantage that you are using for the UI control in the application under test (AUT), the difference being it finds the DLL’s that it is looking for, likely in the Global Assembly Cache (GAC), but when it attempts to convert the UI Control from the AUT, to the UI Control it has a reference to, it throws the exception because they are different.


3.       Throws an ‘Object doesn’t support this property or method’ or ‘Object doesn’t support this action’ exception. But the method or property exists in the intellisense for the object.

Object does not support this property or method

Object doesn't support this action

These exceptions are caused by not having any version of TestAdvantage defined in the SwfConfig. Typically caused by either an empty, SwfConfig and/or by setting the VersionUtility to disabled. But can also be caused by the DLL’s pointing to an invalid file location.

Try IG TestAutomation for HP UFT

Your guide to following the action at Apple WWDC 2016

$
0
0

Apple’s Worldwide Developers Conference (WWDC) is set to kick off on June 13 at the Bill Graham Civic Auditorium and run until the 17th. If you weren’t able to make it out to San Francisco for this year’s WWDC conference, don’t worry— we’ve got you covered!

Apple themselves have made the conference more accessible than ever via live streaming of daily sessions on their website as well as the WWDC app for iOS and tvOS, available for download from the App Store. You can also stay tuned with Twit for coverage via live-streaming and blogging throughout the weeklong conference.

If video doesn’t work for you, Reddit and Twitter are the places to be to keep up with the action. Reddit will be maintaining a live mega-thread throughout the week, and you can follow the below Twitter hashtags to see what others are saying about the conference:

Plenty of news outlets will also be providing up to the minute resources throughout WWDC, including The Telegraph,  The Verge, and CNET. With all these resources available, you’ll be just as up to date as the attendees at Moscone West!

Staying on top of the latest Apple news in order to create high performance, totally native iPad and iPhone applications? Don’t forget to download a free trial of Infragistics’ iOS controls!

The Usability of Self-Service Beer

$
0
0

I recently experienced a major failure in an interesting attempt at self-service automation – self-serve beer taps at a Milwaukee Brewers game. If self-serve beer would work anywhere, you’d think it would work in the beer capital of America - Milwaukee, Wisconsin.

Self service beer machine

If the system worked, self-serve beer taps would require fewer beer vendors, saving the concession company money. It could reduce time waiting in line, increasing convenience for the customers. And I admit it was a fun novelty to try out the new system and pour my own beer.

For a self-service system to work well, it has to be so extremely simple and usable, that customers can literally “walk-up and use” the system without instruction. However, self-serve beer taps are unique, in that they have to be far easier to use than other self-service systems, like ATMs or grocery checkout systems, because customers become increasingly impaired by the product.

So let’s look at how the system works from an ideal perspective.

  1. You wait in line for a cashier.
  2. You purchase a $15 or $25 card, like a gift card, from the cashier. At $7.50 per beer, you can skip the cashier line the second time, with a $15 card.
  3. You take a plastic cup.
  4. You go up to one of the beer taps and tap your card.
  5. On a screen, you select the type of beer you want.
  6. A timer begins counting down on the screen, showing you how much time you have left to fill your cup.
  7. You pull the tap and pour the beer into your cup.

Problems with Self-Service Beer

That sounds pretty simple, but let’s look at the problems with the experience.

You have to wait in line for a cashier

I’m not a big fan of replacing people with machines, but isn’t the main benefit of a self-service system to save money on employees? And aren’t customers supposed to benefit by spending less time in line? Yet, even with several beer tap systems sitting unused, customers have to wait in a single line to purchase cards from the cashier. The line wasn’t that long at a late season Brewers game, but I imagine that the line would be much longer for a more popular game. I found out later that the cashier had an even more important job than to sell cards.

You need to buy a card

When I got to the cashier, I used my credit card to buy a beer card, which I then tapped on the beer machine. Why the extra step of purchasing a beer card? Wouldn’t it save a few steps if I could swipe my card at the beer machine itself? It could even accept cash purchases, as subway ticket machines commonly do. I’ve seen Coke machines recently that accept cash and credit cards, but I suppose the limitation with beer is that it has to be monitored to prevent underage buyers – another reason why beer can never be completely self-service.

The timer is scary

Immediately after selecting the type of beer you want, a big timer appears onscreen with a scary countdown. Your immediate thought is, “Oh crap, I’ve got to hurry before time runs out!” Unless you’re a professional bartender, most people don’t know how long it takes to dispense a beer. The countdown timer scares you into hurriedly pouring your beer, which leads to the next problem.

It’s difficult to correctly pour a beer

When amateurs hurriedly pour a beer from a tap, the cup fills up with foam instead of beer. I used the system three or four times, and this happened to me every time, and it happened to nearly everyone else I saw pouring their own beer. The key is to take your time and pour it very slowly, yet the prominent countdown scares you into the exact opposite action – pour as quickly as possible before the time runs out.

Customers need assistance

Each time I filled my cup with foam, the cashier patiently came over, swiped her master beer card, and poured the beer for me correctly – slowly filling it with a very tilted cup. She did this automatically for nearly every customer, as if it was just an expected part of the process. The customer would screw up pouring his or her beer, and she would come over and do it correctly for them.

Who Does this Benefit?

While the UX designer in me was fascinated at trying out this new system and noting its flaws, the beer drinker in me simply wanted another beer, but this system was too difficult. Self-service systems only work when they benefit both the company and the customer. With the need to employ a cashier to sell cards, check ID’s, and pour beer for most customers, and the fact that a lot of beer is wasted when customers fill up their cups with foam, I can’t see how it benefits the company. With the need to wait in line to buy a card, and with the inability to pour their own beer, it doesn’t benefit customers either.

I think the lesson is that some things aren’t meant to be automated. If I have to pay an outrageous price for stadium beer, I’d rather have an expert pour it for me. If you’re going to make customers do the work with a self-service system, make sure you design and usability test the system to ensure that it’s extremely easy to walk up and use.

Killer UI & Death Ray in Las Vegas

$
0
0

Parallels between familiar architectural conventions and the practice of user experience.

The Deadly Serious Series.

A few weeks ago I was offering an “expert” opinion as a classically trained architect and a User Experience newbie. I stated that in the field of UX one is less likely to affect people’s health and well-being compared to architecture. UX tends to focus on digital rather than physical experiences 

BIG difference in scale. Try comparing an interface to a urban landscape.

and, in principle, UX allows for more research and testing before a product is actually released. Thorough research and testing on a per-project basis isn’t a well established practice in architecture, despite a long history of guidelines, tradition and occasional innovation. Adding more research to the process of putting roofs over our heads, as important as it is, increases time and cost exponentially. As a result, almost everyone pretends that particular elephant is not in the room. 

Like this guy here, Rafael Vinoly. He has an unlucky hot spot for architecture.

Vinoly was the architect of a hotel in Las Vegas, nicknamed “Death Ray”, whose reflective facade melts plastic cups, causes severe sunburns and singes the hair of people having a relaxing day at the pool via a constantly moving, 15sq feet area of highly-focused sunlight. It’s a spa hotel?—?awesome right? :D


I’ll just leave these two here.


A few years later, Vinoly designed a skyscraper in London’s financial district, nicknamed “Walkie?—?Talkie Death Ray” (not that cool the second time, I know). This building’s facade melts cars and allows adventurous people to fry eggs on the spot…just because they can!


Jaguar on the melt & Sustainable architecture on high cholesterol diet.


There are more examples, but you get the idea. Unlike apps, you cannot withdraw those from GooglePlay or iTunes. And having your phone crashing once in a while is hardly comparable to a melted Jaguar or sc?rched hair after a day at the pool. Sure, you can apply some beta enhancements but the damage is done.

As it usually happens, my foolishness got what it deserved. Just 3 days later I was proven wrong as I stumbled upon an article describing an unfortunate incident in which a piece of medical software was a direct contributor to the death of a young cancer patient. In this case, three medical specialists, with over 10 years of experience each, did not notice the red alert text in the top right corner of the screen displaying the patient’s information. They were so distracted by the poorly designed software that each of them, independently, missed it.

It’s not a happy ending story. It’s not a fun one. It’s definitely not one those socially acceptable conversational topics for your next party. It makes you feel kind of uncomfortable and brings home the fact that what we do as UX professionals can have an enormous impact.

If this cloud can be said to have a silver lining, it would be

Looking like that. Some fat SILVER lining we've got here.


that, while we have a lot to learn, we are on the right path toward discovering and establishing guidelines that support the conscientious and careful building of “safe” user experiences.

After all, digital products engage as much of our time as the architecture with which we are physically surrounded.


Dips on the swing! Now go out there and be a good Care Bear:)

UX Scotland 2016 Conference Recap

$
0
0

On the 7th - 9th of June, I was lucky enough to have been invited to speak at UX Scotland in Endinburgh. UX Scotland is the annual hands-on, practical UX and design conference for the UX, Service Design and Digital Communities in Scotland and the north of England. Held at Our Dynamic Earth, more than 200 attendees were given the opportunity to learn from peers and industry leaders, improve their skills and make professional connections.

ourdynamicearth

Our Dynamic Earth /\

Into the mix of workshops and presentations, I spoke about Architecting Speed | Making Racing Data Useful. Centered around work that I’ve done creating a meaningful representation of the large amounts of data collected during motorcycle racing, my presentation was aimed at teaching attendees the difference between data and information.

Architecting Speed | Making Racing Data Useful

Proof I was there ;-) /\

Data vs Information

What typically happens when clients want to make use of large sets of data? They request a dashboard or a data visualization. While those tools definitely make the data more colorful, they don’t necessarily make the data more meaningful. And meaningfulness is key. People don’t act on data. People act on information. Unless the data has been shaped to provide immediate information based on what users are trying to achieve, the burden of converting that data into information is left to the user. When that happens, we’re not doing our jobs.

IMG_3369

Better proof I was there ;-) /\

---------------------------------------------------------

Kevin Richardson has been working in the area of user experience for 25 years. With a PhD in Cognitive Psychology, he has experience across business verticals in the fields of research, evaluation, design and management of innovative, user-centered solutions.

Kevin’s experience includes web sites, portals and dashboards, enterprise software and custom business applications for medical, pharmaceutical, communications, entertainment, energy, transportation and government users.

On the weekends, you can find Kevin on his motorcycle, racing for Infragistics Racing at a number of different racetracks on the East coast

Infragistics Windows Forms Release Notes – June 2016: 15.2, 16.1 Service Release

$
0
0

With every release comes a set of release notes that reflects the state of resolved bugs and new additions from the previous release. You’ll find these notes useful to help determine the resolution of existing issues from a past release and as a means of determining where to test your applications when upgrading from one version to the next.

Release notes are available in both PDF and Excel formats. The PDF summarizes the changes to this release along with a listing of each item. The Excel sheet includes each change item and makes it easy for you to sort, filter and otherwise manipulate the data to your liking.


Windows Forms 2015 Volume 2 Service Release (Build 15.2.20152.2281)

Windows Forms 2016 Volume 1 Service Release (Build 16.1.20161.2033)


How to get the latest service release?


Infragistics Android Release Notes – June: 15.2, 16.1 Service Releases

$
0
0

Release notes reflect the state of resolved bugs and new additions from the previous release. You will find these notes useful to help determine the resolution of existing issues from a past release and as a means of determining where to test your applications when upgrading from one version to the next.

Release notes are available in both PDF and Excel formats. The PDF summarizes the changes to this release along with a listing of each item. The Excel sheet includes each change item and makes it easy for you to sort, filter and otherwise manipulate the data to your liking.

In order to download release notes, use the following links:

Android 2015 Volume 2 Service Release

PDF - Infragistics Android 2015 Volume 2 (Build 15.2.20152.2064)
Excel - Infragistics Android 2015 Volume 2 (Build 15.2.20152.2064)

Android 2016 Volume 1 Service Release

PDF - Infragistics Android 2016 Volume 1 (Build 16.1.20161.2025)
Excel - Infragistics Android 2016 Volume 1 (Build 16.1.20161.2025)

Infragistics Xamarin Forms Release Notes – June: 15.2, 16.1 Service Releases

$
0
0

Release notes reflect the state of resolved bugs and new additions from the previous release. You will find these notes useful to help determine the resolution of existing issues from a past release and as a means of determining where to test your applications when upgrading from one version to the next.

Release notes are available in both PDF and Excel formats. The PDF summarizes the changes to this release along with a listing of each item. The Excel sheet includes each change item and makes it easy for you to sort, filter and otherwise manipulate the data to your liking.

In order to download release notes, use the following links:

Xamarin Forms 2015 Volume 2 Service Release

PDF - Infragistics Xamarin Forms 2015 Volume 2 (Build 20152.2170)
Excel - Infragistics Xamarin Forms 2015 Volume 2 (Build 20152.2170)

Xamarin Forms 2016 Volume 1 Service Release

PDF - Infragistics Xamarin Forms 2016 Volume 1 (Build 16.1.20161.2032)
Excel - Infragistics Xamarin Forms 2016 Volume 1 (Build 16.1.20161.2032)

Infragistics Silverlight Release Notes – June 2016: 15.2, 16.1 Service Release

$
0
0

Release notes reflect the state of resolved bugs and new additions from the previous release. You will find these notes useful to help determine the resolution of existing issues from a past release and as a means of determining where to test your applications when upgrading from one version to the next.

Release notes are available in PDF, Excel and Word formats. The PDF summarizes the changes to this release along with a listing of each item. The Excel sheet includes each change item and makes it easy for you to sort, filter and otherwise manipulate the data to your liking.

In order to download release notes, use the following links:

Silverlight 2016 Volume 1 Service Release (Build 16.1.20161.2050)

Silverlight 2015 Volume 2 Service Release (Build 15.2.20152.2141)

Infragistics WPF Release Notes – June 2016: 15.2, 16.1 Service Release

$
0
0

Release notes reflect the state of resolved bugs and new additions from the previous release. You will find these notes useful to help determine the resolution of existing issues from a past release and as a means of determining where to test your applications when upgrading from one version to the next.

Release notes are available in PDF, Excel and Word formats. The PDF summarizes the changes to this release along with a listing of each item. The Excel sheet includes each change item and makes it easy for you to sort, filter and otherwise manipulate the data to your liking.

In order to download release notes, use the following links:

WPF 2016 Volume 1 Service Release (Build 16.1.20161.2056)

WPF 2015 Volume 2 Service Release (Build 15.2.20152.2160)

The Human Cost of Tech Debt

$
0
0

If you're not already familiar with the concept of technical debt, it's worth becoming familiar with it.  I say this not only because it is a common industry term, but because it is an important concept.

Coined by Ward Cunningham, the term introduces the idea that taking shortcuts in your software today not only means paying the price eventually -- it means paying that price with interest.  In other words, introducing that global variable today and saving half a day's work ahead of shipping means that you're going to pay for it with more than half a day's labor down the line.

The Power of the Metaphor

I've spent significant time doing IT management consulting in recent years, after spending years and years writing code.  And I can tell you that this metaphor for shortcuts in the codebase is a powerful one when it comes to communication between the business and the software development group.  When you explain software decisions to managers and MBAs using the language of economics, they get it.

Because of the metaphor's power and subsequent effectiveness for business concerns, it is often used to describe the health of projects, particularly vis a vis deadlines and milestones.  The developers may communicate that an aggressive deadline will result in technical debt, making features in the future take longer to ship.  Analysts and project managers might account for technical debt when discussing slipped deadlines.  IT upper management might ask for an assessment of the amount of technical in an application when making a strategic, replace/retire/rewrite decision.

The problem of technical debt is for most people, in essence, a problem of time to market.

But I'd like to talk today about the human side of the problem.  And, make no mistake -- in business, all human problems are also business problems, viewed with a wide enough lens.  Unhappy humans are unhappy workers, and unhappy workers are less productive.  Yet, this angle of technical debt is seldom discussed, in my experience.

Unpleasant Work

For a manager, a code base high in technical debt means that feature delivery slows to a crawl, which creates a lot of frustration and awkward moments in conversation about business capability.  For a developer, this frustration is even more acute.   Nobody likes working with a significant handicap and being unproductive day after day, and that is exactly what this sort of codebase means for developers.

Each day they go to the office knowing that it's going to take the better part of a day to do something simple like add a checkbox to a form.  They know that they're going to have to manufacture endless explanations for why seemingly simple things take them a long time.  When new developers are hired or consultants brought in, they know that they're going to have to face confused looks, followed by those newbies trying to hide mild contempt.

To tie this back to the tech debt metaphor, think of someone with mountains of debt trying to explain being harassed by creditors.  It's embarrassing, which is, in turn, demoralizing.

Team Infighting

Not surprisingly, this kind of situation tends to lead to bickering among the team.  Again, the metaphor holds as one would expect this kind of behavior from a married couple with crippling debt.  Teams draw battle lines.

It might be the aforementioned newbies against the tenured staff upon whom they blame the problem.  It might be the maintenance programmers versus the developers or the people on the green field project versus the people responsible for the legacy beast in which the tech debt resides.

Whatever those lines may be, they become real and they become problematic.  They add acrimony on top of the frustration and embarrassment of the problem itself.

Atrophied Skills

As embarrassment mounts and the blame game is played more vigorously, team members can feel their professional relevance slipping away.  After all, tech debt creates substantial drag not only on feature development, but on the general evolution of a codebase.

In these sorts of codebases, everything becomes difficult.  Teams postpone upgrading to the latest version of the language.  They resist incorporating modern architectural and design practices.  They fear to replace outdated third party add-ins with modern ones.  Generally speaking, they want to touch things as little as humanly possible, because doing so further impairs their already lethargic process.  It's too slow and it's too risky.

But even as they make these decisions (or at least live with them when others make them), they understand that their market value is waning with each passing day.  It is not lost on them that while the wide development world embraces the newest JavaScript frameworks and domain driven design approaches, they're struggling to add features to a wheezy, CRUD-based, Winforms application.

The Hidden Business Cost: Turnover and Attrition

Hopefully it should be obvious to management that unhappy developers is a business problem and a serious one at that.  In the current IT market climate, developers have options -- even ones stuck on a legacy codebase with crippling tech debt.

Coming to work each day to work in a tortured code base, with disgruntled people, and with a mounting sense of irrelevance creates a team full of people that are going to be open to other options.  And, sooner or later, they're going to start leaving, and the ones leading the charge will be the ones the organization can least afford to lose.  It will become harder and harder to hire into the group and it will take longer and longer for those who do come in to be productive.

So when you think of tech debt, don't think only in terms of the business problem of delayed features and rising defect counts.  Think of the human cost, and the much more serious, much longer term business problem that results.

Want to build your desktop, mobile or web applications with high-performance controls? Download Ultimate Free trial today or contact us and see what we can do for you.

Infragistics ASP.NET Release Notes - June 2016: 15.2, 16.1 Service Release

$
0
0

With every release comes a set of release notes that reflects the state of resolved bugs and new additions from the previous release. You’ll find the notes useful to help determine the resolution of existing issues from a past release and as a means of determining where to test your applications when upgrading from one version to the next.

Release notes are available in both PDF and Excel formats. The PDF summarizes the changes to this release along with a listing of each item. The Excel sheet includes each change item and makes it easy for you to sort, filter and otherwise manipulate the data to your liking.

Download the Release Notes

ASP.NET 2015 Volume 2

ASP.NET 2016 Volume 1

Webinar Recap: Unit Testing in AngularJS

$
0
0

Earlier this month, we hosted a webinar titled “Unit Testing in AngularJS” for the India region, and we’d like to share the presentation and recorded webinar with you now! In the webinar, we covered everything you need to know to about AngularJS Unit Testing, including:

  • Getting started with Jasmine for JavaScript Unit Testing
  • Setting up Karma
  • Unit Testing Filters
  • Unit Testing Controllers
  • Unit Testing Services
  • Unit Testing $http service

You can view the recording of the entire presentation here:

[youtube] width="560" height="315" src="http://www.youtube.com/embed/NRzuSX1lpls" [/youtube]

You can also view the slide deck here.

Once again, thank you so much for your interest in our webinars – and we look forward to seeing you at a future webinar!


Ignite UI Release Notes - June 2016: 15.2, 16.1 Service Release

$
0
0

With every release comes a set of release notes that reflects the state of resolved bugs and new additions from the previous release. You’ll find the notes useful to help determine the resolution of existing issues from a past release and as a means of determining where to test your applications when upgrading from one version to the next.

Release notes are available in both PDF and Excel formats. The PDF summarizes the changes to this release along with a listing of each item. The Excel sheet includes each change item and makes it easy for you to sort, filter and otherwise manipulate the data to your liking.

Download the Release Notes

Ignite UI 2015 Volume 2

Ignite UI 2016 Volume 1

Webinar Recap: Migrating to Angular 2

$
0
0

From Controllers to Components: Migrating to Angular 2

Ready to migrate an existing Angular 1 application to Angular 2? Join Infragistics' own Craig Shoemaker for this webinar and bring your applications into the Angular 2 world.

[youtube] width="560" height="315" src="http://www.youtube.com/embed/e-zi9QJ1ynY" [/youtube]

In this presentation, Craig will explore some different motivations for migration as well as some new tools and techniques to help support your migration. You'll see how you can run Angular 1 and Angular 2 in the same application with the final result of a fully migrated Angular 2 application.

What is the Extension Method in C#?

$
0
0

I often get questions about the Extension Method in C#. The Extension Method was introduced in C# Version 3.0. and allows us to add functionalities in an existing class without modifying it, extending it, or re-compiling it.

Essentially, the Extension Method allows us to add a new method to an existing class:

  • Without modifying it or adding code
  • Without extending it or creating a new derived type
  • Without recompiling the class

Extension methods are a special kind of static method but can be called on objects like an instance method. So, an extension method can be used in the same way as normal instance methods.


Steps to create an Extension Method

Step 1: Define a static visible class which will contain the Extension Method or Extension Methods. Make sure the class is visible to the client code by applying the appropriate access modifier.

Step 2: Create a static method with at least the same visibility level as the containing class.

Step 3: The first parameter of the Extension Method always specifies the type that the method operates on. Make sure the type name is preceded with the “this” modifier.

Step 4: In the calling code, add the namespace that contains Extension Method class.

Step 5: Use the Extension Method on the type in the same instance method can be used. Keep in mind that we do not need to pass the first parameter because that denotes the type, however we should pass the second parameter onwards to call the extension method.


Let’s create an Extension Method!

Let us go ahead and create an Extension method for the String class. The string class does not have any WordCount method. Let us start with creating a console application project and then add a class to the console application project. We’ll name the class StringExtension.

Once the class is created, we have to perform the steps as discussed earlier:

  1. Make the class static and public in this case
  2. Add a static method
  3. Since the class is public, make the method public too
  4. Pass the first parameter of the static method as the name of the class preceded with keyword “this”
  5. Write the code inside method to implement functionality
namespaceExtensionMethodDemo
{publicstaticclassStringExtension
    {publicstaticintWordCount(thisstring s)
        {int count = 0;for (int i = 0; i < s.Length; i++)
            {if (s[i] != ' ')
                {if ((i + 1) == s.Length)
                    {
                        count++;
                    }else
                    {if (s[i + 1] == ' ')
                        {
                            count++;
                        }
                    }
                }
            }return count;
        }
    }
}

In the above code listing, we have created an Extension Method to count the number of words in a given string. You may notice that:

  1. The StringExtension class a public static class;
  2. The WordCount method is a public static method;
  3. The first parameter in the WordCount method is a string because we are creating WordCount as an extension method of string class;
  4. The first parameter type string is preceded with the keyword “this”.


Before using the Extension Method, let us compile the project. To do so, we need to perform the following steps:

  1. Add DLL to client project, if we have created Extension Method in different library.
  2. Add namespace of the Extension Method class with using directive.
  3. Use Extension Method as normal instance method.

We can use the newly created Extension Method as shown in the listing below:

usingSystem;namespaceExtensionMethodDemo
{classProgram
    {staticvoidMain(string[] args)
        {
            Console.WriteLine("Enter a senetence");string inputstr = Console.ReadLine();int numberofword = inputstr.WordCount();
            Console.WriteLine(numberofword);
            Console.ReadKey(true);
        }
    }
}

As we notice in the above listing, the Extension Method WordCount is used to count the number of words in a sentence. Visual Studio also shows the Extension Methods in intellisense, by appending the word extension next to the method name as shown in the image below:

As we see, we can use an Extension Method in the same way as any instance method. There could be a scenario where we have an instance method and an Extension Method with the same name and signature. In that case, always instance method has more priority over the Extension Method.  There are a few important points we should keep in mind about the Extension Method:

  1. It has lesser priority than the instance method, so if a class has an Extension Method and an Instance Method with the same name and signature, the instance method has priority.
  2. If an extension method conflicts with a member method of target type, the member method is always invoked instead of the extension method.
  3. The extension method can only access private members of the target type.

Extension Methods are very useful to add functionality in an existing class. Many LINQ functions are implemented as Extension Methods. I hope the information provided here will help you in your projects, and thanks for reading!

Visualize a Spreadsheet in Less than a Minute with ReportPlus

$
0
0

Work environments may be ever-changing, but deadlines are deadlines - often non-negotiatable terms. While nothing makes us more productive than the last minute, we live in a world of no excuses: you either deliver your work successfully and on time, or you underperform. Missing a deadline might even mean losing a contract, even if it’s over something as simple as a proposal or a presentation, you’d better have a solid alibi if your work isn’t ready on time. Sound familiar?

Even with enough time, your audience will usually have high expectations regarding the visuals you’re presenting and will quickly lose interest if what you are showing is confusing or unclear. Problem is, when you’re in a hurry and look to software for help, you usually end up with something similar to this:

Don’t panic! Once again, ReportPlus steps up to the plate and delivers an efficient and easy solution for you to create stunning charts and dashboards out of spreadsheets in minutes.

Visualize your spreadsheet in the blink of an eye

With the new ReportPlus Desktop application, you can connect to your spreadsheets (Excel, CSVs, Google Sheets) in real time and turn them into interactive charts with only a few clicks.

Start by connecting to your spreadsheet’s data source – local or cloud file. ReportPlus works with live data without storing or copying it, so whenever anything in your original spreadsheet changes, the changes can be refreshed in ReportPlus as well.

With ReportPlus, you can also select the sheet you want to visualize. Why have equally important charts in different sheets? You can now see all of them in a single easy-to-read dashboard.

Select a section of your spreadsheet to visualize

Working with an impossibly big spreadsheet? No need to modify it with Excel! Bring it directly to ReportPlus and select the range of cells you want to work with:

  • Determine whether the First row contains labels. Unselecting the first row creates a second one with the raw label data.

  • Dynamically choose the range selection, which can prove to be particularly useful when working with bigger data sets. Simply enter your range using excel-format ranges (A1:B8, B2:C7, and similar).

Drag and drop the fields you want to see in your chart

Want to see your sales data by sales rep? Drag the respective ‘Sales’ field to the ‘Values’ box and the ‘Salesperson’ field to the ‘Rows’ box, and you’re ready!

And the most exciting part – pick a chart

After you’ve selected your data, it’s time to choose the chart that will give it the most meaning.

Would it be a bar chart or a pie chart— maybe a trend line? Or how about using a real map to visualize the locations found in your spreadsheet? The choice is yours – test out what works best for you in a matter of seconds!

Try it out and make a difference

We’ve only touched the surface of what ReportPlus Desktop can do to enhance your reporting experience.

Interested in finding out more about ReportPlus? Try our ReportPlus Desktop free demo now, learn on-demand with our free training videos and support documentation, or contact us to see the wonders ReportPlus can do for your team’s productivity!

What’s New in ReportPlus?

$
0
0

This is a HUGE update for ReportPlus! Most importantly we are releasing the first version of ReportPlus Desktop, but first let’s get a little background on where we have been and where we are going with ReportPlus.

Our mission with ReportPlus has always been to help the modern worker gain insights from their data where and when they need it with true self-service that helps you get answers in minutes or hours (not days, weeks, or even months). This led us to build one of the most powerful mobile business intelligence applications that allowed you to connect to over 20 different data sources and create visualizations and dashboards right from your iPad or iPhone. 

Since ReportPlus was released over 3 years ago as a mobile-first data discovery solution, it has been translated to 10 different languages and has been downloaded over 150,000 times by customers all over the world. Those customers have left over 160 reviews with an average rating of 4.5/5 stars in the App Store – and ReportPlus was even featured by Apple in the App Store as a leading app for analyzing data on your mobile device.

It’s been used in industries such as operations, retail, manufacturing, finance, and by roles such as sales, marketing, operations, and many more.  We have heard from those customers that a big differentiator between our product and other competitors like Tableau, Power BI, and RoamBI was that their mobile experiences were strictly for viewing prebuilt dashboards that were built on desktop. If you needed answers while you were traveling or on the go, you would need to have your desktop with you to gain those insights – that’s not very self-service oriented.

“I have been able to create reports directly from remote databases like MySQL. ReportPlus is going to be the most valuable app on your iPad." -  App store review

True Self-Service BI

ReportPlus was the first business intelligence solution to offer true self-service, allowing business users to ask new questions from anywhere at anytime without the need for IT or for a server side component. Our competitor’s solutions, while powerful, were built in a desktop world; but the problem is we now live in the mobile world. As the behavior of business users evolves and Moore’s laws continues to advance mobile technology, the most important platform for creating and viewing dashboards is quickly becoming your mobile device. Any business person evaluating self-service BI solutions in 2016 and beyond should choose a tool that’s built for the way they work today. Check out our free Gartner report on the Eight Steps to Picking a BI and Data discovery tool

Are you ready for the future of BI?

While we continue to be at the forefront of mobile business intelligence, we also are responsive to the fact that not everyone is running their business from an iPad. So, today we are excited announce our first release of ReportPlus for Windows Desktop!

ReportPlus Desktop is about to become the most powerful app on your desktop

ReportPlus Desktop is a touch-enabled business intelligence solution that allows you to create and view your dashboards from your Windows device. Our goal with ReportPlus desktop was to build an app that has the same user-friendly experience of gaining insights without IT within minutes to hours.

We have also updated the look and feel of ReportPlus and made some UX improvements to our iOS and Android apps to make your lives a little easier. This redesign also added some great features we talk about more below.

  • Create once and view anywhere:  If you are a pro subscriber or if you have started a trial, all your dashboards are synced across your devices.

  • Organize your dashboards in folders: We have made it easier to organize your dashboards and create folders that can be shared with your whole team.
  • Share securely in the cloud: Improved experience of sharing dashboards and entire folders with dashboards with others in one action.

  • Link dashboards:  Link a dashboard to another dashboard with additional details for a more immersive experience.
  • Support for Salesforce and Microsoft Dynamics CRM: You can now pull in data from Salesforce and Microsoft Dynamics CRM and gain real insights from your sales data.
  • Mark your favorite dashboards: For quick and easy access
  • Multitasking on iOS: Check your email or edit that excel file at the same time that you are viewing a dashboard in ReportPlus (iOS only).
  • Secure your dashboards: with TouchID and a passcode support on iOS
  • 3D touch support: for iPhone 6s and 6s Plus quickly pull up your recently viewed Dashboards or get started on your next dashboard!

  • View recents
  • Search your dashboards
  • And many more little nuggets of awesomeness!

For existing ReportPlus Pro users, you get ReportPlus desktop for free! We have included it part of your existing subscription. Sign in and download it here

For Infragistic Ultimate and Professional customers, we have include a free subscription for ReportPlus in your Accounts and Downloads section. You also have the ability to embed ReportPlus dashboards into your own iOS, desktop, and web applications with ReportPlus Embedded (additional charges apply, learn more here). 

For new customers, simply start a 30 day free trial and download all the latest versions of ReportPlus for iOS, Desktop, and Android. Then check out our new On-Demand Learning Page where we have added a ton of learning resources including over 35 bite-sized tutorial videos to help you get started with ReportPlus iOS and Desktop as well as our user guides, developer documentation, architectural diagrams, and much more.

For larger teams, we have formally introduced ReportPlus Server which allows you to deploy ReportPlus on-premise for your whole organization.

I told you this release was huge! So don’t waste any time: Get started today and please send us any feedback you have by tapping “Settings” and then “Feedback & Support” on the app home screen. We hope you enjoy this new release!

Viewing all 2372 articles
Browse latest View live


Latest Images