Quantcast
Channel: Infragistics Community
Viewing all 2372 articles
Browse latest View live

Simplifying Objects, Inheritance and prototype in JavaScript

$
0
0

Although JavaScript is a Class-Free language, it supports objects creation, overriding properties/methods and inheritance. In this post, we will explore the concepts of object creation and inheritance.

In JavaScript, Objects can be created in three possible ways:

  1. An object as literal
  2. Using the function constructor
  3. Using the Object.Create method

Object as literal

A simple object Student - as an object literal - can be created as shown in the listing below:

var Student = {

    name:"dj",
    age:32,
    Father: {'name':'Ram','occupation':'service'
    },
    Subjects: [{

        name:"Physics",
        marks:89
    },
	{

	    name:"Chemistry",
	    marks:95
	}]
};

Above we have created an object called Student. There are three types of properties attached to Student: simple properties like name and age, complex properties like “Father”, and an array property called Subjects. We can read properties as shown in the listing below:

console.log(Student.Father.name);for (var i in Student.Subjects) {
    console.log(Student.Subjects[i].name);
}

We can also have a function serve as the property of an object, which is known as the method. So let’s say we want to attach a method “Speak” to the Student object.  We can add the Speak method as shown in the listing below.

var Student = {

    name:"dj",
    age:32,

};

Student.Speak =function (message) {var finalMessage =this.name +" has said :"+ message;
    console.log(finalMessage);
};

Student.Speak("I am the best");

On calling Speak function as method, we will get output as shown in the image below:

There are some important points about the Speak method to remember:

  1. Properties can be added to an object at any time; a property can be added to an object after its creation too. For example, we added the Speak property later to Student object, rather than at the time of object creation.
  2.  In the object’s method, the object is defined by value “this”. That is why we are able to print the name of the Student using this.name in the method.
  3. Calling a function as method is known as “Method Invocation Pattern”

In the above example, we are calling the Speak method on the object “Student”. So the value of this inside the Speak method is the Student object.  

If we want to pass some other object as the value of “this” in the method, we can use the apply or call function. For example, we have one more object called Parents and,

  1. We are calling the Speak method of the Student object directly and the value of “this” in the Speak method would be Student.
  2. We are passing Parent as the value of “this” in the Student object’s Speak method. We are using the apply function to call the Student object’s Speak method and passing the Parent object as the value of this.

We can perform above tasks as shown in listing below:

Student.Speak("I am the best");var Parents = {'name':'Ram'
}


Student.Speak.apply(Parents, ["I am the Best"])

 On running we will get the output as below:

As you may infer from the output, the value of “this” in the second line is Parent, hence as output we are getting Ram for the value of name.

Using function constructor

The second way of creating an object is by using the function constructor. When we call a function using the new operator, the function becomes a constructor and returns the newly created object. In the function constructor, the current object is represented by “this”.

function Person(name, age) {this.name = name;this.age = age;this.message =function () {
        console.log(this);
        console.log(this.name +" is "+this.age +" years old !");
    }

};

var person1 =new Person("dj", 32);var person2 =new Person("mj", 34);
person1.message();
person2.message();

In the above listing, we are calling the Person function using the new operator, hence, the Person function behaves as a function constructor and returns a new object which is being saved in person1 and person2. We are then calling the message method on the person1 and person2 objects.  

On running the above snippet, we will get the output as shown in the image below:

One point worth noticing in the above output is that each object has its own message method. In many cases, you may not want that. Perhaps, you may want the message method shared across objects with the value of “this” set to the object calling the method. This can be done by attaching the message method to the prototype of Person.

function Person(name, age) {this.name = name;this.age = age;

};

Person.prototype.message =function () {
    console.log(this);
    console.log(this.name +" is "+this.age +" years old !");

}
var person1 =new Person("dj", 33);var person2 =new Person("mj", 34);

person1.message();
person2.message();

What is happening here? On executing the above snippet, you will find that the message method is not getting copied for each object, and it is part of the prototype of the Person constructor function.  When running the above snippet, you’ll get the output shown in the image below:

Function constructors enable us to have private properties in the object. We can create a private property in two possible ways –

  1. Using the var instead of this to create a property
  2. Using the REVEALING PATTERN.

A private property can be created using var as shown in the listing below-

function Person(name, age) {var prvvar ="i m private"this.name = name;this.age = age;
};var person1 =new Person("dj", 33);var a = person1.prvvar;
console.log(a);

Here, the expected value of prvvar outside the Person function is undefined. 

Another way a private variable can be created is by using the revealing pattern. We can create private properties by explicitly returning public properties and public methods from the constructor function as shown in the listing below:

function Person(name, age) {this.name = name;this.age = age;return {
        pubvar:this.name +" is "+this.age +" years old"
    }
};var person1 =new Person("dj", 33);var a = person1.pubvar;
console.log(a);

Let us see what is happening here. We are explicitly returning pubvar as public property. In above snippet, name and age properties become private variables and accessing them outside the Person function will return undefined.

 Inheritance in JavaScript

JavaScript supports prototype-based inheritance so instead of class, objects inherit each other. Before we learn about inheritance, let us have a look at a prototype in JavaScript. In JavaScript, a prototype behaves differently for functions and objects.

What is a prototype?

Every function has a prototype property. Let us consider a function as below:

function foo(name) {this.name = name
};var fooPro = foo.prototype;
console.log(fooPro);

As output, we will get an empty object as the prototype value of the function.


A function prototype is the object instance which eventually becomes the prototype of all the objects created using that function constructor. 

Let us go ahead and create objects using the new operator for the foo function. In the below listing, we are creating two objects and then printing __proto__ value of both the objects.

foo.prototype.age =30;var fooobj1 =new foo("mj");var fooobj2 =new foo("dj")

console.log(fooobj1.__proto__);
console.log(fooobj2.__proto__);
if (fooobj1.__proto__ === foo.prototype) {
    console.log("true");
}

You will find that __proto__ value of both objects are the same. Also one important observation could be __proto__ value of objects are equal to the prototype value of the function. The expected output would be as shown in the image below

By looking at the above example we can say that the function prototype is an object instance which will become the prototype of all the objects created using that function as a constructor.

On the other hand, objects do not have prototype values, instead, they have __proto__ value.  Let us consider below example:

var foo ={};
console.log(foo.prototype);
console.log(foo.__proto__);

We are printing the prototype value of foo and also __proto__ value of foo.  For prototype value, JavaScript will return undefined, whereas for __proto__, it will return an empty object. The expected output would be shown as seen in the image below:

Each object inherits an object. Object __proto__ value is set to the object instance from which the object is inherited.

Using __proto__ for inheritance

Some important points about JavaScript inheritance are as follows

  1. JavaScript supports prototype based inheritance
  2.  In JavaScript, objects inherit each other
  3. The Parent object is also known as the prototype of the child object in JavaScript.
  4. In JavaScript inheritance is implemented through  (for objects) special property __proto__
  5. To access a property, JavaScript first searches objects, if it does not find it, it searches that in __proto__ property of object.  In modern browser __proto__ property is also known as prototype property.

Let us start with two very simple objects

var animal = {

    eats:true,
    canRun:function () {
        console.log("yo can run!");
    }
};var dog = {

    canbark:true
};

Here we have two objects: animal and dog. The object animal has two properties – eats and canRun. The object dog has one property: canBark.

Let us see how object dog can inherit the object animal. Using the _proto__ property, dog can inherit animal as shown in the listing below:

dog.__proto__ = animal;
console.log(dog.eats);
dog.canRun();

By setting __proto__ property to animal, we inherited animal to dog. As you notice in the above example, now on the dog object, we can access the eats and canRun properties.

JavaScript interpreter searches for the property in two steps.

  1. First it searches for a property in the current object. If it finds it, it uses it.
  2. If it does not find a property in the current object, it searches for the property in the __proto__ values of the object until the __proto__ value becomes null.

Working with “this” in inheritance

Regardless of the value of __proto__, JavaScript always assigns the current object as the value of “this”.  To understand it, let us modify the previous object,s animal and dog.

var animal = {

    eats:true,
    canRun:function () {this.isCute ="yes"
    }
};var dog = {

    canbark:true
};

As you notice, we have two objects: animal and dog. In the animal object’s method canRun, we are creating a property isCute and attaching that to “this” or the current object. Let us go ahead and inherit animal in dog.

dog.__proto__ = animal;
dog.canRun();var flag = dog.hasOwnProperty("isCute");
console.log(flag);

As you rightly noticed, using the hasOwnProperty() method, I am checking that whether isCute is property of the dog object or not. We will get output of true. This happens because before calling the canRun() method , JavaScript assigns dog as the value of “this”.

The JavaScript method hasOwnProperty() returns true for the object’s own property and false for the properties of the prototype. In this case it would return true, because isCute has been attached as the property of the dog object.

Let us take one more example to explain how value of “this” gets assigned. In the previous example, we used __proto__ to create the inheritance. In this example, we will use the Object.create() method to clone an object. Later in the post, we will cover more about Object.create().

Let us consider we have an object foo as shown in the listing below:

var foo = {

    c:8,
    add:function () {this.c =this.c +1;
    }
};

Object foo has two properties, c and a method add. In the add method, the value of the c property is getting incremented by 1. Next let us go ahead and create another object by cloning object foo using the Object.create() method.

var koo =Object.create(foo);
koo.c =99;
koo.add();
console.log(koo.c);

What is happening in the above code snippet? We are creating the object koo by cloning the object foo. So object koo has all the properties of foo. We are setting the value of property c and then calling the method add on the koo object. As we discussed in the previous example, regardless of the value of the prototype, the value of “this” is always set to the object before the dot in calling the method.  So in this case, the value of “this” is set to the koo object. The expected output of the above snippet would be 100.


With the new ECMA specs, __proto__ is getting depreciated, and all browsers support prototypes. We can use a prototype instead of __proto__ to create the inheritance. Keep in mind that a prototype only works with function constructors, and it is widely supported in all the browsers.

Let us see how a prototype can be used to create an inheritance. Let us start with a function Employee as shown in the listing below:

function Employee(name) {this.name = name;
}var e =new Employee("dj");

We are calling the Employee function as the constructor using the new operator to create an object e.  While executing the constructor, the value of the name property is set to value dj. Next let us go ahead and create another constructor: SuperEmployee.

function SuperEmployee(sal) {this.sal = sal;
}

SuperEmployee.prototype = e;var se =new SuperEmployee(5000);
console.log(se.name);

The SuperEmployee function prototype is set to object instance e.  The object instance of the SuperEmployee constructor is going to inherit the name property of e object instance.  We can also set the prototype of SuperEmployee as shown in listing below:

function Employee(name) {this.name = name;
}

Employee.prototype.age =30;function SuperEmployee(sal) {this.sal = sal;
}
SuperEmployee.prototype = Employee.prototype;var se =new SuperEmployee(5000);
console.log(se.age);

In the above listing, we are setting up the prototype value of the SuperEmployee function to the Employee Prototype. In this way, SuperEmployee will inherit all the properties of the Employee prototype.

Inheritance using Object.create()

In JavaScript, we can create an object by using the Object.create method as well. I find this to be the  simplest way of creating an object.

var foo =Object.create(Object.prototype);
foo.name ="dj";
foo.age =33;
console.log(foo.name);

In the above snippet we have created an object foo, and then dynamically added two properties: name and age. “dj” will be the output, as shown in the image below:

Some important points about Object.create() are as follows:

  • This method takes two arguments .The first argument is the prototype of the object to be inherited, and is the required argument.
  • The second argument is the optional argument, and adds new properties in the newly created object.
  • The first argument can be null, but in that case the new object will not inherit any properties.
  • To create an empty object, you must pass the Object.prototype as the first argument.


We can use Object.create() to create an object inheriting another object instance. For example, let us say we want to inherit foo object in koo object.

var koo =Object.create(foo);
koo.grade ="a";
console.log(koo.name);
console.log(koo.age);
console.log(koo.grade);


While creating the koo object, we are passing foo object in Object.Create. So koo object will inherit all the properties of foo object.  JavaScript will make copy of foo object such that can be assigned as prototype value of koo object.


Putting it all together to create a simple prototype Inheritance chain

So far we have learned about function constructors, object literals, the __proto__, prototype, and Object.create(). Now let us put all them together to create a help function which will accept two objects and create an inheritance between them.  We can create that function as shown in the listing below:

var inherit =function (child, parent) {
    child.prototype =Object.create(parent.prototype);
}

To create the inheritance we are setting the prototype of the child as the prototype of the parent function. Now let us go ahead and create a simple function constructor, foo, and create the object instance of that.

var foo =function () {this.name ="class foo";
}

foo.prototype.print =function () {
    console.log(this.name);
}var f =new foo();
f.print();

If you are following along the discussions you know f is an object instance of foo and as output we will get an output of class foo. Next, let us go ahead and create another function, fooChild, and inherit it from the foo function using the inherit function we created above.

var fooChild =function () {this.name ="foo child";this.surname ="I'm the child of foo";
}

inherit(fooChild, foo);
var fchild =new fooChild();
fchild.print();

In the above code snippet we are inheriting foo in fooChild and also calling the print method of foo on the object instance fchild of fooChild constructor function. This will print the name property of fooChild as shown in the image below:

To print the surname property we need to override the print method in fooChild function, as shown below:

fooChild.prototype.print =function () {
    foo.prototype.print.call(this);
    console.log(this.surname);
}

After overriding, when you call print method on fooChild object, it will print both name and surname values.

In this way we can create a simple inheritance chain in JavScript. Putting it all together, the inheritance chain code will look like this:

var foo =function () {this.name ="class foo";
}

foo.prototype.print =function () {
    console.log(this.name);
}var f =new foo();
f.print();var fooChild =function () {this.name ="foo child";this.surname ="I'm the child of foo";
}

inherit(fooChild, foo);
var fchild =new fooChild();

fooChild.prototype.print =function () {
    foo.prototype.print.call(this);
    console.log(this.surname);
}

fchild.print();

And the expected output would be as follows:

Conclusion

In this post we started with constructing simple objects and ended by creating a function to create a prototype inheritance in JavaScript. We covered the following topics in this post:

  • Object literal
  • Function constructor 
  • Revealing pattern
  • Understanding the value of “this”
  • __proto__ property of object
  • Prototype value of function
  • Inheritance using __proto__ and prototype
  • Object.create() method for object construction
  • Creating an inheritance chain

I hope you like this post and find it useful. Have something to add? Leave a comment! Thanks for reading.


When it Comes to Dataviz, Color is Complicated: Part 2

$
0
0

This is Part 2 (in a series of 2) on why color is a complex and confusing topic. In Part 1 I looked at cases where colors might not be interpreted as expected. Here I'll cover the difficulties of picking a suitable palette.

Be Subtle

Even if you avoid color contrast illusions and palettes that are difficult for those with CVD to interpret, it's still easy to make something that looks bad. Strong, saturated, vibrant colors stand out... so long as they're used sparingly. If everything is strong, saturated and vibrant you'll get something unpleasant like the chart below.

In general, use muted colors for anything that will take up a large area (like bars in bar charts). Use stronger colors for smaller items (such as points) and to highlight. Using a color that's simply different to the norm, rather than significantly more vivid, can also be effective for highlighting something significant:

Be Consistent

If you use color to distinguish two or more categories in one chart it makes sense to repeat the color scheme when the same categories appear in another chart in the same document. If you keep swapping and switching your audience might get confused and draw the wrong conclusions from your presentations of data. That's worse than not showing the data at all.

Sometimes this advice may come in to conflict with the advice above regarding object size and color vibrancy: if one chart shows bars and another points then something has to give. The best option may be a compromise set of colors that are slightly more vivid than you'd like for the bars and slightly less vivid than ideal for the points. Another option is to use the same hues (eg "red", "blue", "yellow") but vary the lightness depending on the chart type. (It's also plausible that a dot plot might be as good as or better than a bar chart anyway.)

As discussed here, you should also try to follow common conventions where applicable. This, of course, may be at odds with my advice about traffic light colors in Part 1. I did say color was complicated!

Get Some Assistance

Unless we want to draw particular attention to one category, the colors we select for our categories should be of similar vividness. That is, one should not stand out more than the others. This is a tricky task. You can't, for example, just compare the sums of the red, green and blue values a color picker tool will give you. Human perception of color simply doesn't work that way. Creating color scales that encode numerical values is just as, if not more, difficult.

You may be coming to the conclusion that creating a good color palette for visualizations can be hard. The easy way out is not to bother. That doesn't mean you have to accept your software's defaults though.

One of my favorite resources is ColorBrewer. It offers an interactive palette selector that was designed with maps in mind. There is, however, no inherent reason not to use it for other visualizations. You can pick from a range of "sequential", "diverging" and "qualitative" palettes. The qualitative palettes are best for encoding categorical information. Sequential and diverging palettes can be used for encoding values; the latter should be used when you wish to highlight how the high and low values differ from some middle value (perhaps the mean or median or simply a 0 point when both positive and negative values are possible). There's an option to export a chosen palette as a JavaScript array that I find particularly helpful.

Printing is Problematic

ColorBrewer lets you restrict palettes to only those that are CVD friendly, those that remain distinguishable when photocopied in black and white, and/or those that work well when color printed. This latter option illustrates another issue when it comes to color: The range of colors that a typical monitor can display (its "gamut") is less than a human can see but greater than can be printed on a basic CMYK printer. What you see on your laptop screen is generally not what you get on paper.

But Wait! There's Much More

My goal here wasn't to make you scared of using color, but to point out some of the dangers in order that you may be able to avoid them. I've skimmed over most of the underlying science, partly because it's not exactly trivial and partly because it's not really my area of expertise.

Everything I have covered barely scratches the surface. I don't have space to tell you about the problems with rainbow color palettes or why brown is a bit weird or anything about opponent process theory or perceptual color models or to explain the difference between luminance, brightness, and lightness (these confuse me all the time). All these things and a lot more are covered in chapters 3 and 4 of Colin Ware's book Information Visualization (mentioned in Part 1). It does get quite technical a times but I highly recommend it for anyone who wants to know about the science of color and of information visualization.

Try one of our most wanted features - the new XAML 3D Surface Chart and deliver fast, visually appealing and customizable 3D surface visualizations! Download Infragistics WPF 16.1 toolset  from here.

Mute On, Mute Off?

$
0
0

Sometimes I’m amazed when very simple usability problems are overlooked in an otherwise good design. Google Maps is a great mapping app, with one major exception – turning off the audio directions. As you read this, you might at first think, “Big deal! That’s not that hard to figure out.” But remember that this is an app that people use while driving. So it needs to be extremely easy to turn on or off the audio directions.

So how do you turn off the audio? You might think to tap on the menu icon in the lower right corner, and look for something that says “Audio” or “Sound.”

Google Maps app main screen

But instead of an Audio or Sound setting, you see the Mute setting – Off. This is not a button that performs the action Mute, but a property called Mute with the state On or Off. Why is that a problem? It’s exactly backwards to reality and expectations. Sound or Audio is the property that people want to turn on or off, not Mute.

Google Maps app Mute off settingGoogle Maps app Mute on setting

Mute On or Off requires you to stop and think, “Mute is off. So that means… audio is on, I guess? Yes, I suppose that’s what it means.” Keep in mind that you’re looking at the screen and thinking about this as you hurtle down the highway at 70 miles per hour.

It would be much more natural if the setting was Audio – On/Off. Yes, we’re all familiar with Mute buttons to turn off audio, but those are action buttons. Pressing a mute button performs a muting action. That’s different from a Mute property with On/Off states.

Mute On/Off is like a light switch with the label Darkness On/Off. It’s the exact opposite of what you normally expect and requires you to perform mental gymnastics to figure out what it will do. Keeping with the light switch comparison, a Mute button is like a single button with the label “Turn off Lights.” Neither of those cause confusion because each is a single action that tells you what will happen when you press it.

How else could this be designed?

The other major navigation apps handle turning the audio off in a much more natural manner. Apple Maps has a Navigation Voice setting, with the options, “No Voice, Low Volume, Normal Volume, and Loud Volume.”

Apple Maps app navigation voice settings

Waze has buttons for Sound On, Alerts Only, and Sound Off.

Waze sound settings

These apps provide options for concepts that we easily understand (Sound and Navigation Voice) and match what we want to do – turn them on or off.

The lesson is, provide natural-language labels for functions and actions that your audience understands. Stick with conventions used elsewhere, and avoid technical terms (like Mute) when natural language (Sound On/Off) will be more understandable. And when in doubt, test with users to find and fix problems like this.

Microsoft Power Apps: a look at UX capabilities

$
0
0

If you’ve ever been frustrated by the complexity of getting even basic enterprise apps built, you’re not alone. Gartner recently revealed that they expect the demand for enterprise mobile apps to grow at least five times faster than availability over the coming years.

Whether you’re looking for simple forms for mobile colleagues, workflows for their daily tasks or more powerful BI or specific jobs, mobile apps can be amazingly helpful. They save time and let your employees become a lot more productive.

However, many companies simply can’t produce all the apps they’d like their workers to use. Unless yours is a particularly large organization, the chances you’ll have a team of in-house developers is small. You’re therefore dependent on third party teams, consultants and freelancers; all costly and in high demand everywhere else.

Microsoft has recognized this problem, and in November 2015 announced the upcoming release of PowerApps. This amazing little tool might just change your life!

What is PowerApps exactly?

PowerApps represents a very clever move from Microsoft. Having recognized that they will always struggle against Apple and Android in the consumer app stores, they’ve turned their attention to the burgeoning enterprise app market instead.

PowerApps effectively allow anyone to play at being a developer. By providing a simple and intuitive environment for creating apps without any code, employees can connect to company data and create functional (if somewhat basic) apps by themselves.

This certainly isn’t the first time anyone has attempted to allow non-techy people to build apps, but it’s perhaps the most advanced attempt.

As good as this sounds on paper, will it be a success in practice? By providing your colleagues with quick and dirty apps, will you be damaging their User Experience? And is this even a problem?

What you get with PowerApps

PowerApps will basically work as follows. Once you’ve downloaded your version of PowerApps (there are going to be a variety of levels from free to premium), you get to choose from a series of templates for your app including:

  • Event signups
  • Product catalogues
  • Surveys
  • Workflows
  • Service desk calls
  • Opportunity tracking
  • And more

You can then introduce data from a wide range of Microsoft and third party sources such as:

  • SQL Server
  • SharePoint Server and Online
  • Salesforce
  • Google Drive
  • OneDrive
  • Dropbox
  • Dynamics CRM Online

Business users can then build apps with no code by connecting to these data sources. Apps can be built for iOS, Android and Windows from an easy to use ‘drag and drop’ design canvas.

You can introduce controls, graphs and other features straight from a side panel of commands. Apps and APIs are hosted in Azure, and your business user can share the app with his/her colleagues via a simple email link, making the whole process very quick and easy.

Should mobile developers start rewriting their CVs?

In a word, no. PowerApps is a very welcome move from Microsoft. It will allow teams to create apps that, frankly, would be a waste of time and money to farm out to professional developers. PowerApps let users build the kind of simple apps that otherwise would never have been built because they were, well, too simple!

Microsoft are kind of gambling on the idea that for forms, workflows and approval scenarios, business users aren’t going to be bothered about having the world’s most beautiful app. The focus is all on function, much less on aesthetics.

For a more complex app – and anything that involves B2C – you’re going to need a much more powerful design tool. Nonetheless, PowerApps does include some neat UX features.

  • Charts. PowerApps let you import data from a whole range of sources and display these as column, pie and line graph style charts. They might not have the most appealing visualizations, but they do what they need to do. If your salesperson simply needs to see how much they’ve sold this year, as the following chart shows, PowerApps does the trick:


(Source: Microsoft)


  • Multimedia. One thing we think is particularly neat about PowerApps is the ability to add multimedia. Business users with no technical know-how can add videos, music, voice recordings and images. Mobile users will be able to use the capabilities of their devices and add information directly into the app.
  • Interactions. When building an app, even the least experienced business person will be able to implement some basic UX features around interaction. For instance, they can change how pages will appear on screen, how they will scroll and how images react when end-users select them.
  • Galleries. Again, this is pretty straightforward stuff, but PowerApps lets business people define how images and content are displayed in their apps, their size, shape and position. The following screenshot shows how users can define the layout of an image gallery.


 (Source: Microsoft)

The power’s in your hands

PowerApps are a very welcome move from Microsoft. Anything that puts more IT power into the hands of business people has to be a good thing and will help users achieve a lot more in terms of mobility.

Of course, they’ll never offer the same level of control as some of the more advanced offerings. PowerApps are a little like Paint is to Photoshop. Nonetheless, for simple, functional apps, PowerApps is a very exciting move and we can’t wait to see what impact it will have on the market.

Use Infragistics' Indigo Studio new, amazing feature to create remote usability studies and see click-maps and stats about how users interacted with your prototype. Find out more here and get started right away. 


What are the real benefits of being an MSDN subscriber?

$
0
0

A typical software developer’s day includes anything from writing and coding new programs to resolving bugs and attending meetings with clients. With the rapid evolution of technology in the past decade, developers should also spend at least part of their day keeping up to date with tech news. Be it a new tool or framework, IT pros need a finger on the pulse - you never know when you’ll be asked to work on an entirely original technology.

Developers are a mixed bunch, but if they share one thing in common, it’s the unending requirement to learn about the software they work with. You just cannot rely on one particular set of technologies as you can always count on disruptive tech knocking even the most popular tools into irrelevance. We all know, for instance, how the Pascal and VB languages are now decreasing in terms of popularity and usage.

Taking that further, when applying for jobs, interview questions often focus on the technologies you know and how comfortable you are in adapting to a new technology. Equally, your contribution to the community is also analyzed.

Microsoft Developer Network (MSDN)

Microsoft’s Developer Network one of the largest community platforms for developers working on Microsoft technologies. MSDN is free for students at participating universities and provides resources required in the development lifecycle. Key benefits of an MSDN subscription include:

  • Online and offline versions of Microsoft Product documentation
  • Software licenses for Microsoft Products like Visual Studio, Windows, Azure, etc.
  • Technical support
  • MSDN magazine
  • Updates on various events and conferences h

So, how can you use your subscription to the max?

Develop and test solutions in the cloud with Azure

Microsoft provides Pay-As-You-Go access to the Azure test environment with an MSDN subscription. This gives access to Virtual Machines, the Azure Database, BLOB Storage, Websites, Mobile services and more.

Development Centers for all Needs

With an MSDN subscription, you get to use specific development centers for all Microsoft Products. Within these development centers, you get all the resources required to build your application under any framework or devices with all the documentation and resources available for each tool, framework, languages or service.

MSDN forums

Once developers start learning and implementing new technology, it’s common to encounter issues which aren’t completely covered in the documentation. MSDN provides a great platform under the covers of MSDN Forums for users to post their issues and queries. These forums are constantly moderated and have a healthy participation rate. Gaining insights from others has never been so easy, with a talented pool at your disposal, subscribers can pick the brains of some of the best programmers and developers around.

Improve your coding skills

With access to Microsoft tools and technologies, developers are free to learn any new technology using the MSDN subscription. With MSDN subscriptions, subscribers can access exclusive benefits and use vast development resources.

Let’s say I want to develop a PowerShell script to create my own SharePoint farm on Azure which I can use for my SharePoint Development. We all know that the cost of a SharePoint license is pretty hefty and not every developer cannot afford it. But with the Azure monthly credits I can swiftly create my own VM with SharePoint configuration and use it for developing my PowerShell script to test on the VM. A major plus point.

Great for beginners

Microsoft has launched various free services for developers such as Visual Studio Online, Visual Studio Code or Visual Studio Community so that a beginner can quickly start learning about the new technologies without worrying about the licenses. Visual Studio Code is available for Windows, iOS and Linux too. As per Microsoft, Visual Studio Community has all the features of Express and more, and is still free for individual developers, open source projects, academic research, education, and small professional teams.

Availability of code samples

Developers often need to jump right into application development and if there are any ready-made code samples available, this can save them a lot of effort. Microsoft provides code samples for various technologies on its MSDN site under the Code Samples. This resource offers more than 8,000 samples to help developers to begin using various technologies. There’s also an open source community called codeplex where you can find many more Microsoft code samples. And they just keep on giving - Microsoft has a visual studio gallery that currently comprises of more than 5,000 projects for you to learn from.

MSDN offers developers a pretty good deal; it provides a space where they can explore Microsoft’s products and use them in their day to day development and testing activities. For anyone working in Microsoft land, MSDN offers as many individual benefits as there are individual users,

The complete solution for any large-scale digital transformations, enterprise mobilization and modern UI initiatives. See what's new in Infragistics Ultimate 16.1!


Wearing your business apps – IoT’s place in the enterprise

$
0
0


It’s time to place your bets on what was the first ever piece of wearable tech. Ready?

Google glass? No. The Apple Watch? Wrong again. How about Dr. Julius Neubronner’s Miniature Pigeon Camera? Close, but no cigar. The answer dates back to the 17th-Century, when Chinese mathematicians transferred the trusty abacus onto a ring.

We’ll admit that the ‘tech’ side of this particular invention is up for debate, but the idea of getting our accessories to help our day-to-day activities has been around for much longer than we might think.

Another step beyond mobile working, wearable tech aims to operate silently in the background. While virtual reality (VR) and augmented reality (AR) are beginning to make a breakthrough, we’re currently able to kit ourselves out fairly well with wearable tech. Google Glass takes many of the core functionalities of your smartphone – GPS, messaging and emails, translation – and puts them right before your very eyes. And for those that don’t like wearing glasses, Samsung has even patented a ‘smart’ contact lens. Recent research saw Apple responsible for two-thirds of all smart watch shipments in 2015, accounting for over 12,000,000 units – and Fitbit posted a new quarterly shipments record in Q4 last year. It seems that “software increasingly belongs on the wrist, and this is the direction the market is going.”


So what can we expect of wearable tech to come? Well, for one, it might not be entirely wearable… Ingestibles may be the next step for keeping track of your vitals, and could tell you when you last took your medication. ‘Embeddables’ and ‘invisibles’ are designed to capture vital data through your skin; the former are inserted into muscles, skin or nerves while the latter are ‘stick-on tech’ like a skin colored patch or tattoo-like sensor.

In 5 years’ time, we might all be calling friends on our watches, following directions through our contact lenses while dressed in connected outfits. But what about wearables and the Internet of Things when it comes to enterprise?

The shift to the enterprise

A 2015 Forrester report found that 51% of tech & business leaders identify wearables as a critical, high, or moderate priority for their organization. The same report states three core factors that are driving wearable computing into the enterprise:

  • The connected world: sensors, networks, and analytical software to connect physical objects to computer systems.
  • Predictive analytics: Software/hardware solutions that allow businesses to analyze big data sources to deploy predictive models and improve performance.
  • The mobile mind shift: The expectation of attaining desired information at any time, on any device at a person’s moment of need.

These three factorsmake the case for enterprise wearables, and perhaps the Internet of Things in general, a more reasoned one. Smartphones in particular have raised our want and need for a constant stream of information and knowledge, and yet are still restricted in some aspects. While it’s true that mobile devices have made considerable progress on the ease of access to content and data, it becomes a different story entirely with something that is physically attached to your body. Forrester believe that in 5 years’ time, the market for company-provided wearables will be larger than the consumer market.

The new wave of BYOD

It might not be right around the corner, but companies will soon need to embrace these connected devices the same way they did with smartphones and tablets. It involves ensuring you have the right policy controls to support wearables, as to increase employee productivity without putting sensitive enterprise data at risk. Devices such as smart watches are designed to be on you at all times, but smaller devices have more of a tendency to get lost. For this reason, it’s vital that your company employs strong user authentication that is able to secure data on a device if it happens to fall into the wrong hands. The following are 5 steps to consider when dealing with wearable enterprise technology:

1.   Sensitive data

When mobilizing your data it will help to know which content is sensitive and which isn’t. Most companies (we hope!) already have policies for categorizing sensitive data, but this may change as it is mapped to new technology. So, make sure you’re fully up-to-date with you company policies before you begin.

2.   Security policies

It helps to view wearables as an extension of your overall mobility strategy. Smart watches, for example, are largely extensions of smartphones, so it’s important to analyze how well your existing smartphone data protection policies will apply to smart watch usage. You may need to make some adjustments to current policies as not to impact employee productivity.

3.   Profile your users

Most companies will employ varying levels of access to content for employees on mobile devices, and the case should be the same for wearables. Leaking data to outside vendors could result in huge problems, so you need fine-grained control.

4.   Protect the device data

Separating corporate data from personal data is a key aspect to your security policy, especially when devices like smart watches are even more personal than smartphones. As such, encryption used for sensitive, corporate data should be different from that used for personal data.

5.   Usability matters

If you can’t make your security measures usable, then employees will look for ways to work around it, and eventually find them. Wearables are sure to offer a new level of contextualized user experiences, with access to relevant information faster than ever before.

Wearable technology's impact – or at the least, future impact – on the enterprise world cannot be undervalued. IDC estimate the wearable tech market to react almost 112 million units by 2018, and this rapid growth will require companies to embrace the new wave of connected devices.

The complete solution for any large-scale digital transformations, enterprise mobilization and modern UI initiatives. See what's new in Infragistics Ultimate 16.1!


Public Speaking 102

$
0
0

Gearing up even better to deliver a talk that lasts even longer

Last month I set out on a quest to share my observations on what makes a conference talk stick in the memories of the audience. I outlined the importance of a confident beginning and end, striving to make your points easier to comprehend and tailoring your talk to the expected audience. I also shared my personal favorite, especially when talking about design: showing actual objects. That was a good, but far from exhaustive, beginning and therefore, I want to add to that list a few more ideas. Putting everything in action is neither pleasant nor easy but I can assure you that the reward in the end is worth the effort. Let’s go on with the list.

Speak calmly. Don’t run through your presentation, speaking at a rate that people find hard to comprehend. If you have too many slides or too much content to share, then you probably didn’t do your job selecting and preparing the topic well enough. Giving a talk is like telling a story, so when you practice pay attention to the pace of your storytelling. When a new section of your topic is about to begin leave a few silent seconds, take a few steps, breathe in deeply and start the next section. People need some time to comprehend what you just spoke about and to prepare for what is coming. However, don’t be too phlegmatic or you risk having your audience silently fall asleep.

Plant your feet but move your body. Taking a few steps when switching between topic sections is fine but if you intend to elaborate on a section, keep your feet planted on the ground. Once you stop walking at the beginning of a new section, the audience will automatically refocus and you should remain in the same area until the section is over. This does not mean to freeze and only move your lips, of course. Use body language and gestures to stress particular concepts – just try not to wander around too much.

54326214613476

UXify Bulgaria 2015 opening session. Image attributed to: Infragistics Inc.

When things go wrong tell a joke. Prepare a few beforehand and if you lose your train of thought or there is a moment of awkward silence, take advantage of it, rather than make excuses. My observations show that when you make excuses, you usually lose attention and credibility for the rest of your talk. If you mess things up, soldier on. If you treat it as insignificant, so will the audience. By the end of your talk, they will probably have forgotten all about it.

Respect your audience. You might be “the expert” on stage but that does not make you superior to your audience. You connect with them by minimizing the perceived gap between you and them. Taking care to do this well will allow your ideas to really “get under their skin”. Treat questions with respect and give your best answer. Be extra careful during the Q&A session because you may be asked questions that are only marginally related to your presentation topic. They might be trying to be polite, since no one else is asking questions, or may have missed (or misunderstood) something. Even when the answer is obvious, try to understand why the question is being asked and politely give the best answer you have. If this seems impossible at the time, invite the person to discuss his question once the Q&A is over. Remember that being disrespectful to someone, especially to someone who is trying to be polite, is unprofessional and never appropriate.

Prepare well. I usually start rehearsing a week before the talk and do so for an hour every day. I tell the story until it becomes a habit in order to be able to observe myself in the process. This not only builds up my self-confidence, but it also allows me to reflect on my pace, focus on the right gestures and work on simplifying the way I express my ideas.

Becoming a good speaker requires dedication, commitment and the right set of habits - habits that the tips in these two blogs aim to help you establish (check out Public Speaking 101 if you haven’t already). However, as with habits (that are not permanent and require practice to maintain), a person may deliver one talk that is excellent and lasting only to follow it up with a mediocre one. It is crucial to understand that the key to successful public speaking is not only building the right set of qualities but in maintaining them over time. Follow the rules that work best for you diligently, do it for every talk that you give, and let me know which worked best for you. Brace yourself - conferences are coming!

New Solutions to Old JavaScript Problems: 2) Default Values

$
0
0

Introduction

This is the second in a series on how new JavaScript features, introduced in the ECMAScript 2015 standard (aka ES6), allow for simpler solutions to some old JavaScript problems. In part 1 I covered block scope and the new let and const keywords. Here I will look at default arguments for functions.

Default Arguments the Old Way

Here's a very simple JavaScript function for logging a greeting message to the console:

let greet = function(name){
   console.log("Hi, I'm " + name);
}

And here's two examples of calling that function:

greet("Elvis Presley"); //Hi, I'm Elvis Presley
greet(); //Hi, I'm undefined

Since the second call to greet doesn't pass in any arguments, the call to console.log just outputs name as "undefined". We can add a more appropriate fallback by using the logical OR operator, ||, inside the function and supplying a suitable moniker:

let greet = function(name){
   name = name || "John Doe";
   console.log("Hi, I'm " + name);
}

greet("Elvis Presley"); //Hi, I'm Elvis Presley
greet(); //Hi, I'm John Doe

Sometimes the use of || doesn't work as intended. Here's the skeleton of a function for plotting the mathematical function y = x2 + 1 using IgniteUI. (I've deliberately left out important aspects like chart labels to keep the code to a minimum).

let makeChart = function($selector, min, max){"use strict";		
   min = min || -5;
   max = max || 5;

   let stepSize = (max-min)/10000;
   let data = [];

   for(let i=min; i≤max; i=i+stepSize){
      data.push({x:i, y:Math.pow(i,2)+1});	
   }

   $selector.igDataChart({
      dataSource: data,
      width: "300px",
      height: "200px",
      axes: [
         {
            name: "xAxis",
            type: "numericX",
            minimumValue: min,
            maximumValue: max,
         },
         {
            name: "yAxis",
            type: "numericY",
            minimumValue: 0
         }
      ],
      series: [
         {
            name: "series1",
            type: "scatterLine",
            xAxis: "xAxis",
            yAxis: "yAxis",
            xMemberPath: "x",
            yMemberPath: "y",
         },
      ],
   });
}

Assuming three floating (left) div elements — with id's of "chart1", "chart2" and "chart3" — we might draw three copies of the function like this (here $ is the jQuery object):

makeChart($("#chart1"));
makeChart($("#chart2"), -3, 3);
makeChart($("#chart3"), 0);

The final results may comes as a surprise: rather than the x axis starting at 0, the third chart is identical to the first.

This happens because 0, the value passed in for the minimum value of the x axis (min) in the third call to makeChart, is falsy. That means the line

min = min || -5;

changes min to -5.

We can get around this easily, but with a few more keystrokes, by explicitly comparing min (and max) to undefined, rather than checking for truthyness:

min = min!==undefined ? min : -5;
max = max!==undefined ? max : 5;

With this in place, the third chart does now have an x axis that starts at 0.

More Intuitive Default Arguments

ES6 makes setting defaults easier and the new syntax may seem familiar if you've ever programmed in C++ or R. Simply add an equals sign and the default value for each function argument that needs one. The makeChart example above then becomes:

let makeChart = function($selector, min=-5, max=5){"use strict";

   let stepSize = (max-min)/10000;
   let data = [];

   /*rest of the function*/
   
}

In an ES6 compliant browser, this is equivalent to the example above, where we compared min and max to undefined, but with less typing. I think it also makes the code more transparent and a casual user no longer has to inspect the function body in order to find the default values.

The greet function from earlier can also be simplified:

let greet = function(name="John Doe"){
   console.log("Hi, I'm " + name);
}

greet("Elvis Presley"); //Hi, I'm Elvis Presley
greet(); //Hi, I'm John Doe

More Complex Examples

ES6 default values don't have to be simple strings or numbers. You can use any JavaScript expression and later arguments can refer to earlier ones.

One common way to introduce object-oriented programming to new coders is through the construction of various animal classes and objects. JavaScript isn't really a class-based language but objects are still important. Object factories - functions that return objects - are an easy way to make a large number of objects quickly. They're also a place where default arguments can be very useful. Let's create some talking dog (!) objects. The following is all perfectly valid ES6 code that utilizes default values (the defaults for name are, apparently, the most popular male and female dogs names as listed here at the time of writing):

let createDog = function(gender="male", name=(gender==="male")?("Bailey"):("Bella"), hobby="barking"){
   return {
      name: name,
      gender: gender,
      hobby: hobby,
      sayName: function(){console.log("Hi, I'm " + this.name); return this;},
      sayGender: function(){console.log("I am a " + this.gender + " dog"); return this;},
      sayHobby: function(){console.log("I enjoy " + this.hobby); return this;},
   };
};

Here's an example of use with the default values:

createDog().sayName().sayGender().sayHobby();

This prints out...

Hi, I'm Bailey
I am a male dog
I enjoy barking

We could specify all arguments, for example...

createDog("female","Barbara","fetching").sayName().sayGender().sayHobby();

prints out...

Hi, I'm Barbara
I am a female dog
I enjoy fetching

We can also accept default values for one or more parameters by passing in undefined. For example...

createDog("female",undefined,"fetching").sayName().sayGender().sayHobby();

leads to the output

Hi, I'm Bella
I am a female dog
I enjoy fetching

Note that this does mean you can't pass in undefined as a placeholder when you don't know the true value. You probably want to use null instead.

The expression for the default name isn't particularly robust. For example, the following is probably not what was intended:

createDog("Male").sayName().sayGender().sayHobby();
Hi, I'm Bella
I am a Male dog
I enjoy barking

In this case gender was set to "Male", which doesn't match "male", thus the default name expression results in a "Male" dog called Bella. We could just change the first argument to isMale (or isFemale of course) and assume a Boolean input. And that might be the sensible option here. But it doesn't lend itself so well to highlighting the fact that we can use even more complex expressions, so we won't. Instead we'll use the following modified function:

createDog = function(gender="male", name=(gender.charAt(0).toUpperCase()==="M")?("Bailey"):("Bella"), hobby="fetcing"){
   return {
      /*object unchanged*/
   };
}

Now any gender string beginning with "m" or "M" is taken to be male for the purposes of default-name assignment. That could mean "male", "Male", "man", "m", "M", or "Marmalade". Any other string — "female", "Female", "JavaScript" etc — will set name to "Bella" if you don't provide an alternative. This version will also throw an error (a good thing, generally) if you pass in something really silly for gender, like {} or /male/.

It's important to restate that ES6 default values are assigned from the left. It may be that you'd prefer name to be the first argument of the createDog function. The following won't work when called without a name parameter because the expression for the default tries to use gender before it is defined.

let createDog = function(name=(gender.charAt(0).toUpperCase()==="M")?("Bailey"):("Bella"), gender="male", hobby="reading"){
   return {
      /*object unchanged*/
   };
}

If you come to JavaScript from a language like Python or R then you may be used to using named parameters alongside default arguments in your function calls. This is still not possible in JavaScript. The closest you can do is to use an options object in place of multiple arguments. Unfortunately, combining an options object with ES6-style default parameters is not particularly easy (see here for details).

Now with full support for Angular 2 Beta and Bootstrap 4, see what's new in Ignite UI 16.1. Download free trial today.


Feature Spotlight: Infragistics WPF NuGet Packages

$
0
0

On Infragistics product ideas website there is a highly voted product idea titled “Use Nuget for Distribution”.  Well, it turns out that Infragistics does have NuGet packages for some of their products that are installed locally with the Infragistics Ultimate Installer.  You just have to know where to look.

Where can I find them and how do I use them?  Good question! 

Find and Extract Packages

Simply navigate to “C:\Program Files (x86)\Infragistics\2016.1\WPF\NuGet Packages” and you will find two zip files.  One for the standard assemblies and another for the “version free” assemblies.

nuget packages location

Extract the content of the zip file and you will see the available NuGet packages for all of the WPF controls.

Create a Local Repository

Next create a new folder somewhere on your hard drive to be used as the location of your local Nuget repository.  After you create this folder, copy all of the Infragistics WPF NuGet packages and paste them into this location.

Infragistics WPF nuget packages

After that, open up Visual Studio and open the NuGet Package Manager Settings

open package manager settings

Now, add a new NuGet Package Source and set the “Source” to the location of your newly created folder containing the Infragistics WPF NuGet packages.

create new nuget package source

Using The Infragistics WPF NuGet Packages

Now, all you have to do is create a new WPF application in Visual Studio and open the NuGet editor.  This can be done by right-clicking the solution and selecting “Manage NuGet Packages for Solution”.

In order to add the Infragistics WPF NuGet packages you must change the “Package Source” to use the local repository you created in the previous steps.

change nuget package source

Once you do this, all of the Infragistics WPF NuGet packages will be available.

add Infragistics WPF Nuget Packages

Now search for the control of your choice, add the package, and you are ready to rock-and-roll!

That’s it!  It’s that simple.  Now go have some NuGet fun.

As always, feel free contact me on my blog, connect with me on Twitter (@brianlagunas), or leave a comment below for any questions or comments you may have.

What’s the Key to a Winning Data-driven Strategy?

$
0
0

Today, we are creating and consuming more data than ever. In business, in our personal lives, on our desktop, with our multiple mobile devices. In fact, every day we create 2.5 billion gigabytes of data. Big Data is becoming one of the biggest driving forces behind the global economy and is actually supporting economic development in developing countries.

The prediction is that in less than five years, 40 zettabytes of data in the world will exist. For context, three years ago the entire Internet was estimated to hold about 5 billion gigabytes – which is 0.5 of 1 zettabyte. So, that would be an increase from 5 billion to 400 Billion gigabytes.

Of course, these numbers - their sheer size - sitting on your screen, are impossible to really comprehend. Certainly without the help of a visual aid.

Mind your own data business

So, where does your company’s data fit into all this? It’s pretty straightforward, actually. Your Line of Business (LOB) tools are the biggest producer of data for your organization. For example, if your company uses SharePoint or Office 365, it’s likely then that you have a wealth of data concerned with every aspect of your business. The likelihood also is that this data is quite complex and dispersed across your entire LOB infrastructure – which in and of itself can be disjointed.

In today’s post we focus on the key to a winning data-driven strategy, so you can collect all your significant data in a single space and effectively and consistently streamline your visual presentation of that data for better decision making. Get every member of your team ‘in on the ground floor’ with your findings and/or strategies.

Within your SharePoint ecosystem you likely have lots and lots of existing and useful company data:

  • Calendars – to schedule meetings, set reminders, help manage your team members
  • Employee vacation roster – so you can easily see who has scheduled time off; or who is available for a project at certain time, etc.
  • Daily task manager – to provide your busy day with much needed structure
  • Document folders – holding a wealth of information and crucial work
  • Excel spreadsheets – the inevitable source of massive amounts of data

This, of course, is just the ‘tip of the iceberg’ when it comes to the amount of information you carry within your Line of Business systems. Bear in mind also that a lot of this data is dynamic and ever-changing. So it stands to reason that you should be able to view and display it in a vibrant and active way.

Static data doesn’t ‘excel’

The unfortunate fact is - despite the spike in data volume that we are now creating on a daily basis - the means that most companies use to view their crucial information is as static as simply numbers on a spreadsheet. Microsoft Excel has been a market leader in data management since the mid-eighties but, in the thirty years since, as discussed above, data creation and the volume of data companies are storing, analyzing and using these days has exposed some of the program’s weaknesses.

For instance, after a certain volume of information, an Excel spreadsheet doesn’t scale properly as the complexity of your business task or function increases. It can be cumbersome to share multiple spreadsheets with colleagues and migrating data from other apps and locations into Excel can be slow and tedious. It also fails in its one-dimensional view of graphs, without a drill down function. Graphs in Excel exist only to show results, rather than find patterns and trends.

Data that goes for miles

You should be doing more with all your available data. The key is using the information that you’re creating, that you’re recording, the data that is building up, to help inform your business strategy. If ‘knowledge is power’ then managing your knowledge is the way towards harnessing your power in the most effective way.

When it comes to taking your important information and being able to successfully use it as part of your business strategy you need a great Data Visualization solution. If the question is: what is the key to a winning data-driven strategy? Then, enabling LOB users with self-service data visualizations & data discovery is the answer.

That’s where ReportPlus comes in. ReportPlus can handle an extraordinary amount of data across a wide range of applications and clients. With a Desktop and iOS creator apps, and Android and web viewers, ReportPlus enables you to connect to your data from your SharePoint Sites as well as Office 365, Microsoft Dynamics and many more, and create impressive and dynamic visualizations that you can share with your whole company no matter where your colleagues might be.

Designed for mobile working, with ReportPlus you can quickly view dashboards and reports on any device, so you can interact with your data in the office or on-the-go. The apps and dashboards can also be installed securely On-Premise, for compliance needs, or if you just need extra piece of mind.

The app is a modern Business Intelligence essential for data-driven professionals (and let’s face it, today most of us are). One of the greatest assets of ReportPlus is its self-service design and how simple it is to use. Connect to your data from every source you use - files On-Premises, content in the cloud - and combine it into one dashboard and create compelling data visualizations, without the need for detailed IT knowledge or experience. Used to make faster, smarter decisions by the guys working on the building site as well as the head engineer in charge of the operation, ReportPlus gives us insights in an instant.

To find out the extent of the power of ReportPlus, visit its website and seehow this data visualization solution can be the key to a winning data-driven strategy for your business.

What's New in IG TestAutomation 2016.1

$
0
0

The primary focus for Infragistics Test Automation is to offer you peace of mind. Such that when you develop with our controls, your teams can seamlessly implement automated testing of the user interface (UI) to confidently produce higher-quality releases. IG Test Automation, currently supports our Windows Forms controls via HP’s Unified Functional Testing (UFT) and IBM’s Rational Functional Tester (RFT).  We also support our WPF controls via HP’s UFT.

As IG Test Automation’s purpose is to automate tests of the UI of applications using IG controls, this what’s new will start off with the new controls and I will follow with changes in existing controls that had changes that would affect how the UI behaved. 


New Controls supported by IG TestAutomation

XamScatterSurfaceChart

By far the most requested item on our Product Ideas page, this new chart is perfect for those scenarios where you need to visualize price volatility plots in the financial services industry, instrument measurement, and equipment testing, process simulation, modeling, and monitoring applications.

XamScatterSurfaceChart


UltraSpreadsheet

 New to Infragistics 2016.1 is a fully-featured spreadsheet control, which allows for the visualizing and editing of spreadsheet data, represented by the data model supported by the Infragistics Excel Engine. Currently only supported in HP's UFT.

UltraSpreadsheet


IG Controls with UI-Altering Improvements

UltraWinGrid

The UltraWinGrid has several new features this release, two of note that required additional support for IG TestAutomation are :

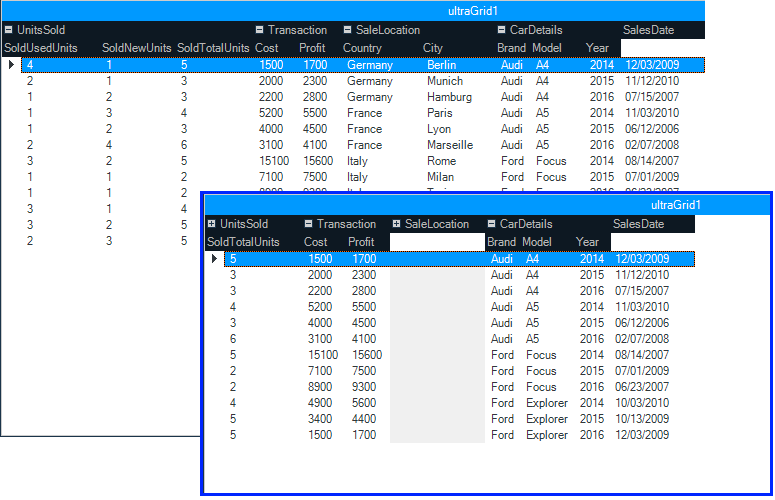
Collapsible Column Groups

 The UltraGridGroups collection supports ExpansionIndicators, allowing the user to hide all columns assigned to them. This improves the readability of your grid by allowing users to quickly prioritize information most relevant to them.

UltraGrid's Collapsible Column Groups


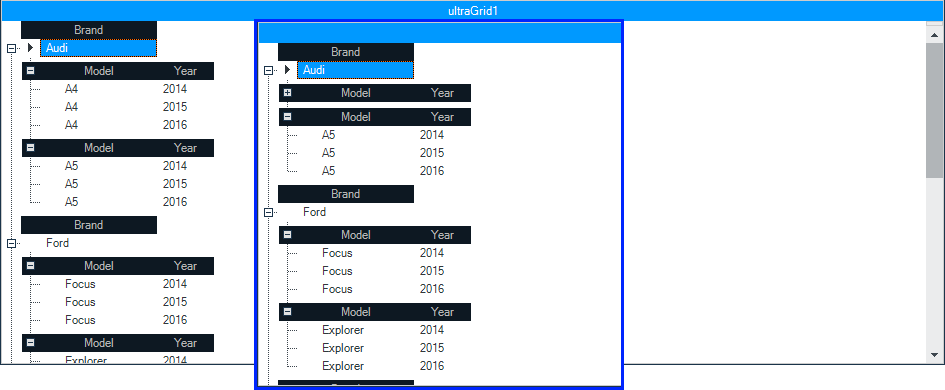
Collapsible Child Bands

 The UltraGrid supports BandExpansionIndicators at the header of each child band, allowing for collapse/expand funcitonality on each individual child band. This improves ease of navigation between sibling bands with large data sets and reduces information clutter on the UI.

UltraGrid's Collapsible Child Bands

xamTabControl Tab Dragging

As of 16.1, if you’re using the xamTabControl, you can now reorder tab items by clicking and dragging a tab item with your mouse to a new position. To enable this feature, simply set the TabDragMode property to the desired behavior.

xamTabControl, dragging Tabs

xamDataGrid

Collapsible Column Groups

Hey didn't I just read about this feature? Yup, what seemed like a good idea for Windows Forms, we decided to add it to our xamGrids too.

 xamDataGrid Grouped Fields

Field Moving

While not necessarily new to 16.1 controls as a feature, it is new to 16.1 IG TestAutomation as a recordable action. Previously it was only possible to move fields by using SetNAProperty.

More Right to Left Support in Windows Forms

We started in 14.1 introducing Right to Left support in our of our editor controls. In 16.1 we expanded our right to left support to our UltraTab and UltraTabStrip controls.


Download the free trial of IG TestAutomation for HP 16.1
http://www.infragistics.com/products/windows-forms-test-automation-for-hp/download

Download the free trial of IG TestAutomation WPF for HP 16.1
http://www.infragistics.com/products/wpf-test-automation-for-hp/download

Download the free trial of IG TestAutomation for IBM RFT 16.1
http://www.infragistics.com/products/windows-forms-test-automation-for-ibm/download

Voice your suggestions today, for the products of tomorrow 
http://ideas.infragistics.com/

Why prototyping is not only essential for the design process but for overall product development too

$
0
0

Why prototyping is not only essential for the design process but for overall product development too.

Developing or building anything new involves a long and complex process and requires real attention to detail. Whether it’s the construction of a new skyscraper or the design of a new mobile app, the steps from initial conception and those first sketches right through to the final build and finishing touches all require meticulous attention to detail.

Now, for any good developer, designer or architect, creating that fantastic ‘thing’ - be it an app, new building, or product - is the ultimate goal. How they achieve this is down to a whole host of significant factors. An area that has undoubted importance along the way is prototyping.

The word prototype or ‘prototypon’ derives from ancient Greek, and means “primitive form”. And that’s exactly what it is. Google’s definition, “a first or preliminary version of a device or vehicle which others forms are developed” takes the point further. A prototype is a very simple means of showcasing to stakeholders what a final design may look like by painting a picture of something that is tangible - not just a static wireframe or idea in a colleagues head. Let’s take a look at some of the advantages of prototyping.

Four key benefits of prototyping

1. Save money

You could argue that prototyping will increase the overall cost of a project. At first view, you’d be correct. However, it’s far less expensive to resolve and rectify any problems with a new design in the early stages of development than it is towards the end of a project. Imagine missing the prototyping phase when building some new software, being a week from a ‘go-live’ date and finding out there’s a problem with the UX or user journey. A project can grind to a halt, resources, in the form of money (and time!) are needed to fix the issue, all of which is made more complicated by the fact so much work has been done to date. As Benjamin Franklin said “by failing to prepare, you are preparing to fail”. Don’t let that be you.

2. Get instant feedback

As with any product, the end goal is making something that is appealing to end users. A big part of what we do at Infragistics is helping developers build new apps and designs with some great UI dev tools and components. By creating a prototype during the design process and putting it in front of your target audience you can get feedback on what they like, dislike, would change, would add and so on. In addition, when a prototype is in the hands of a user you don’t always know what the product will do or how they’ll use it. With a prototype, you do.

It’s far easier for people to make a decision by actually seeing something! Tools like Indigo Studio are great when it comes to designing animated UI prototypes. Remember, companies pay millions of dollars on market research to hear from users - a prototype is a simple way to showcase your offering and receive feedback that is instant and actionable.

3. Test to your heart’s content

A piece of software or new product that has been through prototyping will, 9 times out of 10, have a much more desirable design quality and be far closer to the needs of the user, compared to a product that hasn’t. How do you get to that point? Testing. A prototype should be seen as a ‘working document’, it will always evolve and change. Very rarely will the first prototype be the finished article.

It’s human nature. We test ourselves over and over to make sure we know that critical bit of information when it comes to an exam. The development of any product is similar. You want the best outcome, so it will go through a number of stages. By testing - looking at areas such as cognitive habits - you can continue working towards a product that will finally meet the brief and is optimized for end users.

4. Make the most of your time

The time spent developing a product can be all-consuming. Thinking about every little detail is certainly a good skill to have and desirable when it comes to micromanaging. However it shouldn’t become a detrimental factor. You want to work in the most efficient way possible and maximize your time. By creating a scalable, lightweight and functional prototype during the design process, it will eliminate a number of ‘what-ifs’ and any confusion when it comes to coding, and focus attention on other areas of a product's development.

A picture paints a thousand words

Building a product that rocks can be one of the most satisfying and rewarding feelings. Seeing your vision come to fruition and in the hands of a user, or making a mark in the world of architecture makes all the hard work, time and effort worthwhile Prototyping plays a pivotal role in both the design process and to the overall product development. Get it right, and the life of your treasured design will help others for years to come.

Use Infragistics' Indigo Studio new, amazing feature to create remote usability studies and see click-maps and stats about how users interacted with your prototype. Find out more here and get started right away.

Reviewing Usability Study Results

$
0
0

Banner image

One main purpose for conducting a usability study is to find out how well your design meets users’ expectations, and get some targeted usage data to help evaluate this in practice. However, collecting a lot of data about usage is useless unless it’s actionable. That is, it should quickly let you identify tasks that are problematic, and even better if it let's you identify the problematic step in the task flow.

Making usability study results actionable is the motivation behind how we have designed the study results view. And all this without having to review the results of each and every participant. The idea is to quickly gather insights from the aggregated statistics. We agree that its 's important to understand what a specific user did; however, in order to design for more than 1 user, we rely on how a group of users performed on the task. We should be looking for patterns in the usage and not solo data points.

Naturally, there is no report, without actually setting up a study. To learn about how to set up usability studies for your Indigo Studio prototypes, read the following post: 

Set-up Remote Unmoderated Usability Studies

Remote, and Unmoderated Usability Studies

Usability studies on indigodesigned.com are remote and unmoderated in nature. That is, the study moderator does not have to be present when users participate in a study. The main advantage of this technique is that more than 1 user can simultaneously participate in the study. This also frees you of the need to explicitly schedule time with participants. Participants can participate when they have the time.

The usability studies section on indigodesigned.com shows you any studies in progress or completed in the past. The results are updated in real time. As in, as and when a participant completes a task, the task statistics are updated. The study report consists of the study results overview, a detailed task report, and a click-map view.

Study Results Overview

Study overview provides a high-level summary of how many users participated and completed the task successfully. It shows avg. time required to complete the task and whether users made of use of guidance. If the user used guidance, the task is automatically marked as failed. Study Overview

Task Details Report

Task details view provides a more granular view of how participants completed a particular task. You can see how many completed, skipped or failed the task. The percentage completed gives you an idea of how early or late did the design fail. Task details view The task details view also shows a step-by-step view of the task. If for some reason say most users quit or requested guidance at step 2, you know that’s the part of the flow you need to redesign first. Participants have the option to leave comments while they complete the task or at the end of it. When they do, you will see a comment count next to the tis step.

Click-Map view

The click-Map view shows where the participants ended up clicking. It captures both attempted interactions and successful ones. Successful interactions are those that lead to the next step in the recorded task flow. The click map only shows max. 2 attempts per participants to make the visualization actionable. Click-Map View The theory is that if the participants were unable to proceed after two failed attempts, there are already significant usability problems to fix.

Summary

Reading not your thing? No problem. We recorded a quick video just for you.

[youtube] width="650" height="488" src="http://www.youtube.com/embed/CHK7rGMBUcA" [/youtube]

This article provided a quick overview of the usability study report. We describe the different views available to help you identify where things are broken from the users' perspective. However, you will still need to qualify, categorize and prioritize these issues. This is where you, as some one responsible for the UX, will make recommendations. The remote usability studies facilitate making these recommendations faster than moderated sessions.

About Indigo Studio for Interaction Prototyping

Don’t have Indigo Studio? Download a free 30-day trial, which will let you try all of the prototyping goodness! Experience our unique story-driven prototyping approach-- a LEAN UX/AGILE prototyping solution.

Download Indigo Studio

Looking to suggest improvements and new ideas for Indigo Studio?

Submit a new idea

If for some reason you are having trouble with Indigo Studio, check out our help topics, forums or contact support.

Get Support

Follow us on Twitter @indigodesigned

View Release Notes

Best Practices: Team Productivity, Regardless of Devices or Storage Services

$
0
0

2015 was a big year for a number of business trends, as collaboration, the cloud, mobile working and productivity made statements on their importance in the enterprise. With technology evolving at such an impressive rate, 2016 has continued on from where 2015 left off, and pushes us further into the fabled “office of the future”.

A lot of these prevalent business trends are at the heart of SharePlus; many of the app’s core features involve maximizing team collaboration, working outside of the traditional office space and on mobile devices.

Continual quest

Despite the fact that roughly half the adult population owns a smartphone, mobile is still in its infancy in terms of its influence on customer behavior. Of course, the smartphone will no doubt mature at an astounding rate given how quickly it has started off (that current 50% is expected to rise to 80% by 2020) and as such the enterprise is doing all it can not to get left behind.

SharePlus is available on iOS and Android devices; optimized for the mobile support of SharePoint and Office 365. Offering a mobile user experience with the ability to access, edit and share all your files, images, documents and more, you’re able to connect to several SharePoint portals without the need of your IT department.

No Wi-Fi? No problem!

The appeal of mobile working stems from the ability to work from any location; you’re no longer chained to your desk if you want to be productive. We’ll admit that working in any location may be a bit of a stretch - it would prove difficult to continue responding to emails if you were inside the Krubera Cave, for example. Difficult, but not impossible. Offline capabilities mean you can stay productive without a Wi-Fi connection, adding, editing and deleting files which will re-sync when a connection is reestablished.

The power of social

It’s difficult to think of social as a new trend due to its monopolization of the web, but in terms of the enterprise it’s still seen by some as a novelty. Its value should by no means be overlooked, however, as it has become the new standard for companies of all sizes to communicate quickly and freely. SharePlus’ Social Module brings social to SharePoint, allowing you to share ideas, start conversations and keep up to date with your colleagues. Access both your public and private document libraries from your personal SharePoint storage to collaborate with others on documents.

The Documents Module

As the rate of data creation grows with no sign of slowing, 2015 saw the beginning of the battle for Cloud storage with heavyweights Microsoft, Google, Apple and Amazon all staking their claim. The latest update which came to SharePlus improved upon the Documents Module– created to facilitate access to all your relevant documents. Your files can be accessed from a number of different locations: your personal cloud storages, a private local storage on your device or a shared location across your network. The cloud content sources that are available are:

  • OneDrive for Business

Office 365 or SharePoint personal cloud storage (this will be pre-configured if you are using SharePlus Enterprise and have Social features enabled).

  • Google Drive

Cloud storage

  • Dropbox

Cloud storage

As we create more and more content, storing it somewhere that’s easily accessible becomes more of a necessity than a want. A centralized location for your documents is another step towards a more mobile, collaborative working environment.

Accessing your files from content sources is a simple task, with a varying list of actions (dependent on the content source). For Google Drive and Dropbox (as well as any Network Drives) users can create documents using Local Files or your Photo Album, add folders to organize your files, as well as record photo, video and audio from your device.

For those of you using OneDrive for Business, the above applies, plus a few other features stemming from Office 365 compatibility. Along with creating documents or folders, users are also able to add their own ReportPlus dashboards. In the settings menu, users can alter the way SharePoint lists are displayed – switching between the SharePoint list view or the SharePlus list view. SharePlus also allows for ad hoc sorting and grouping: by dragging list columns to the ‘Group By’ and ‘Sort By’ sections, you can specify group criteria and sort criteria respectively.

Best practices

With the addition of new content sources, there are more ways than ever to work on your files and documents with SharePlus. As we are likely to create even more data and content every day, having a centralized space to store it all is critical. SharePlus provides you access to more of your content than before, meaning you can enable your teams to be work anytime anywhere while mobilizing your SharePoint investment.

It’s show time! Infragistics is the exclusive sponsor of the MS Dev Show Podcast

$
0
0

Infragistics has always been an active member of the developer community, with the belief that sharing knowledge is vital part of bringing the community together and helping others. In keeping with that tradition, we are excited to announce that Infragistics is the exclusive sponsor of the MS Dev Show podcast!

If you are a .NET lover or a Microsoft technologies user, this is the podcast to have on your playlist. Covering the latest in Microsoft development news and trends, MS Dev Show has a diverse range of topics that will appeal to everyone, including:

C# Language and Future

Azure Data Lake

Developer Tools and Patterns

DevOps and Release Management

Enterprise Universal Apps

Hosts Carl Schweitzer and Jason Young keep the show fresh by inviting interesting guests who are experts in their fields. Carl, a Microsoft Windows Development MVP and Senior Software Engineer at Concurrency, Inc, has a diversified experience in a wide array of technologies utilizing Microsoft development platform. Jason, on the other hand, is a Principal Program Manager with comprehensive experience in software development, Information Technology management and executive leadership. So with all this expert insight, you know you’re in for some enlightening and entertaining discussions.

We’re huge fans of engaging ways of expressing ideas and sharing knowledge. And if you are too, be sure to follow all the action on MS Dev Show - you can subscribe via:

Or follow the show at:

The complete solution for any large-scale digital transformations, enterprise mobilization and modern UI initiatives. See what's new in Infragistics Ultimate 16.1!


Developer News - What's IN with the Infragistics Community? (5/9-5/23)

XLR8 Conference 2016 Recap

$
0
0

The past Saturday, 14 May 2016, Infragistics held its first XLR8 conference in Sofia, Bulgaria and judging by its success there will be many more to follow. JavaScript, Angular and Mobile dev skills were all accelerated by the leading minds in the field and as a bonus we also had a separate track for accelerating developers’ soft skills and design knowledge as well.

XLR8 logo

The day started with a beautiful morning and attendees filling the space as the networking started to gain speed. Meanwhile our great photographer (besides also being one of our talented Infragistics designers) Svilen Dimchevski was warming up with some creative shots like this one:

Morning networking

To boost the mood and start a day of insights and discussions, our own VP of Product Management, Community, and Developer Evangelism Jason Beres gave a brilliant keynote on mobile & IoT opportunities, the importance of embracing a UX-centered work process and the mobile state of the art in the enterprise world today. His intriguing talk got everyone’s attention that could be felt throughout the hall and confirmed by the feedback gathered following the event. Jason’s presentation received the highest ratings for his keynote! Our Infragistics star Jason rocked the stage yet another time!

Keynote by Jason Beres

After such an inspiring beginning, the attendees then continued to the other talks eager to learn more. The developers’ track was like honey to the bees in the face of the dev minds in the audience.

Dev track

Our own Infragistics leaders in the JS & Angular field started the track with the “Evolution of JS&Web – Past and Present Challenges” by Konstantin Dinev and “Angular 102” by Damyan Petev who also ran a live demo during his session.

Damyan Petev's live demo and Konstantin Dinev's session

Lunch time gave the attendees the opportunity to explore the car of the year and get massages in between expanding their networks of IT contacts.

Car of the yearNetworking

The afternoon continued to keep the developers’ interest with “Integrated Web Stack with Angular 2” by Minko Gechev, book writer and specialist in Angular 2, “Building Product Hunt for iOS” by Radoslav Stankov & Vladimir Vladimirov and the other star of the day (as shown by our feedback form) Martin Chaov with his talk on “Multithreaded JS Applications in the browser”.

Martin Chaov's talk

Parallel to all the code ingenuity happening next door, were the soft skills and design accelerator presentations. This track brought diversity and enrichment beyond the code for our attendees. The topics covered were “Programming yourself for success. Myth or reality?” by Magdalena Nikolova, an NLP specialist, followed by “Communications in Stressful Situations” by Simon Harris. The design tracks were in the hands of our Bulgarian Infragistics team of UXers, including myself. Spasimir Dinev enlightened the audience on how to optimize their mobile designs with his “Choose their destiny” talk. My turn came with “The WHYs and HOWs of including the users in the process” for which the little XLR8con birdy helped me to get people’s attention on key points by his little flute whistles:

XLR8 birdy

Ain’t he so darn cute? How could I have resisted his assistance (me being one of those crazy bird watching people)?

To end the track with grace and some cookies (!!) was Stefan Ivanov’s creative session on “Designing for Constrained Productivity” during which he cooked up for us (figuratively and literally!) some design cookies. What a tasty way to end the day :)

speakers-design-&-soft-skills-track

I want to thank everyone who took part in organizing this first edition of what will be a conference with accelerating success from year to year. We also want to thank our numerous attendees and sponsors without whom this conference would not have been possible. On a final note, congratulations to the lucky attendee who left with a brand new BB-8 Droid as their new self-minded buddy to play with at home!

IG team

Hope to see you next year, when the XLR8 conference will be even more acceleratingly fun and insightful.

9 Tips for Writing Secure Applications in ASP.NET

$
0
0


Security is one of the most important aspects of any application – and when we talk about security, particularly in ASP.NET applications, it is not limited to development. A secure app involves multiple layers of security in the configuration, framework, web server, database server, and more. In this post, we’ll take a look at the top nine tips for writing secure applications in ASP.NET.


1- Cross Site Scripting (XSS): This vulnerability allows an attacker to inject some malicious code while entering data. It could be JavaScript code, VB script, or any other script code.By default, ASP.NET MVC validates the inputs and throws a server error in case of script. Say we put the script in the input form:


When we submit the above page, we’ll get the error below:


By default, the razor view engine protects from XSS attacks. But there are certain scenarios (blogging, social applications, etc.) where we might need to allow html tags in input controls. For that, we have an option to add the ValidateInput filter as false:


 [HttpPost]

 [ValidateInput(false)]

  publicasyncTask<ActionResult> Register(RegisterViewModel model)

  {

       if (ModelState.IsValid)

       {

            //  Etc.

}

  }


But this is very risky because here we not validating the complete request. Say the model has twenty properties, all will be exempt from the validation while we might need to allow html in only one or a few controls.


In that scenario, instead of using this ValidateInput, we should put the an attribute AllowHTML in the specific ViewModel’s property as:


publicclassRegisterViewModel

    {

        [Required]

        [AllowHtml]

        [Display(Name = "User Name")]

        publicstring Name { get; set; }


    }


Now we can use tags for the name only.


2- Cross site resource forgery (CSRF):  CSRF (also known as one click attack) is a type of malicious attack where unauthorized commands are fired from a trusted website where the user is authenticated. In real world scenario, say the user logged into an application with windows/cookie based authentication. Now without logging out, the user visits a malicious site and clicks on a button. The external website initiates a request via your website for doing an unethical operation. It will be considered as valid request because the request is authenticated.


To prevent from CSRF attacks, MVC provides AntiForgeryToken mechanism. For that we need to use AntiForgeryToken helper in view as


  @Html.AntiForgeryToken()


And to validate the token, we need to put  Antiforgerytoken filter over action as:


[ValidateAntiForgeryToken]


 public async Task<ActionResult> Register(RegisterViewModel model)

{

      if (ModelState.IsValid)

      {


          // etc.


      }


      return View(model);

  }


It creates two tokens in response, one is set as a cookie and other is set in a hidden field as:


<form action="/Account/Register" class="form-horizontal" method="post" role="form">

     <input name="__RequestVerificationToken" type="hidden" value="Qorw9RPABdHoRC7AojnSnQYYuGZP5iPF63UFVSw_[…]" />


While submitting the form both of the tokens (cookie and hidden field) are sent to the server. Both are validated at the server, and  if either one is not present or tampered then the request is not allowed.


3- Handling Errors Properly: Errors are bound to happen, and they find their way to reach user. But if they are not handled properly, errors can leak internal information to the outside world, which can be a threat to the application. Following YSOD is common when an unhandled exception occurs:


But see how much information it is showing to outside world: internal code, physical file structure, stack trace, and the version of ASP.NET and .NET framework.


One quick fix could be setting customErrors mode on as:


<customErrorsmode="On">

</customErrors> 


This will show an ASP.NET default error page in case of each error. To handle it in better way, use custom errors mode RemoteOnly and have a common error page which gets displayed in case of error.


<customErrorsmode="RemoteOnly"redirectMode="ResponseRewrite"defaultRedirect="~/Error.aspx" />


Here we are displaying our own error page in case of an error.


4- SQL Injection: SQL injection is a well-known security vulnerability, but it is still not handled properly in many applications. SQL injection allows hackers to tamper with existing data, modify transactions, or even delete data or databases, which can be a major loss to business.


Using this technique, the hacker injects some malicious SQL commands via input. These commands have the power to change the SQL statement running on the server.  Say authenticating a user in an application, we have written a query in a class as:


"select * from Users where UserName='"+txtUserName.Text+"'and Password='"+txtPwd.Text+"' ";


Now user puts the following value in user name:


Now the query will be generated on server as:


select * from Users where UserName='’ or 1=1 --' and Password='"+txtPwd.Text+"' ";


This will always return items and allow users to get into the application.


To handle this, the best way is to use SQL stored procedure where we will pass the values a parameter or at least use the parameters as:


"select * from Users where UserName= @username and Password=@password”


5- Click-Jacking: Click-Jacking is another major vulnerability that gets ignored normally. In this, the attacker uses an opaque layer to trick the user to click on a button or link on different page (say transfer button on the bank website) while they are intended to click on the top level page.


To avoid this issue, we should not allow any website of different domain in iframe to open. To achieve this, we need to add a response header X-FRAME-OPTIONS as deny or sameorigin. In ASP.NET, we can set in Global.asax as:


void Application_BeginRequest(object sender, EventArgs e)

{

    HttpContext.Current.Response.AddHeader("X-FRAME-OPTIONS ", "DENY");

}


It will add the header in all the responses send by the application.


We can also use IIS to add the same header. In IIS, go to the intended website, and go to HTTP Headers tab and add a custom header with the header X-FRAME-OPTIONS as discussed. You will need to restart IIS to get it into effect.


6- Hide Application Structure/ Directory Listing– Would you like to share the folder structure of your application to the end user?  No! Right? Let’s see an example. I have deployed ASP.NET web forms default application on IIS so now when I access the URL, it displays:


It shows all the files and folders available under Account. This information can be a potential threat to the application if publically available.


Directory browsing should be disabled at IIS. When it is disabled, we see:


It returns 403 (forbidden), but that still leaves some vulnerability as it tells the user that this folder is available. When we try to access a directory which is not available, it returns 404.


For this, we can write our own custom http handler and configure it so that it always return 404 whenever anybody try to access a folder.


7. Encrypt sensitive information in Web.config– Many times we put critical information in the Web.config, most commonly the connection string.


To encrypt any part of connection string, we need to navigate to framework folder on command prompt (say C:\Windows\Microsoft.NET\Framework\v4.0.30319 ) and run the following command:


aspnet_regiis -pef "connectionStrings" path


Here path is the path of the folder where Web.config resides. After running the command, it shows as:


Similarly we can encrypts other section like <appsettings> etc.


7– Secure the cookies: Cookies are small text stored by browsers on users’ machines that travel between the web server and browser. Cookies are used to store the user related information for the specific website. In ASP.NET, Session Id is one of the most common pieces of information for which cookies are used to save.


As this information is stored in plain text on a user’s machine, it could be an easy target for attackers. There are couple of steps we need to take to avoid storing data in cookies, such as setting an expiry date and encrypting the data. Apart from these two steps, there are two more things which we should do:


1-      Allow cookies on SSL only

2-      Set the cookies as HTTPOnly. This makes sure that cookies cannot be read by client side script so our session or Form authentication token could not read on a browser.


We can make the settings in Web.config as:


<httpCookies domain="String"

             httpOnlyCookies="true "

             requireSSL="true " />


8- Encrypting View State- View State is one of the most common techniques used to maintain the state between the Page PostBacks in ASP.NET Web forms. View State is saved in a hidden variable on the page with id __VIEWSTATE. When we see that in view source, we find that it contains a series of numbers and characters. Be sure that it is not encrypted but in base64 format. Anybody can decode it to read the information.


There are two options to encrypt and make it tamper proof. There is the property ViewStateEncryptionMode, which can be set at page level in the aspx file or can be set it in Web.config which applies to all the pages in the application. It encrypts the view state before putting it into the response. Similarly, another property, EnableViewStateMac, can be set as true at the page or in Web.config. It creates a hash of the view state content and added in the hidden field. In the next post back, again the hash gets created and verified. If it does not match, then post back is rejected and an error is thrown.


9- Remove sensitive information from Response Headers: Here is the response header of a page of an ASP.NET application:


Here we can see that it is revealing too much information to the end user, which they don’t require like in IIS version, site built on, and ASP.NET version. If an attacker knows the loopholes of any of them, he or she can exploit the vulnerability. This information is by default added, and we should remove it unless and until specifically required.


a-      To remove ASP.NET version header, we just need to add the following in the Web.config:


<system.web>

  <httpRuntime enableVersionHeader="false" />

</system.web>


b-      To remove MVC version, we need to go AppliCation_Start event in Global.asax and add the following code:


MvcHandler.DisableMvcResponseHeader = true;


c-       X-Power-By is added by IIS and can be removed by adding the following configuration:


  <system.webServer>

        <httpProtocol>

            <customHeaders>

                <removename="X-Powered-By" />

            </customHeaders>

        </httpProtocol>

  </system.webServer>


Conclusion: In this post, we discussed that security is key for any web application, and if not handled properly, it can harm the business significantly. We discussed nine of the most common vulnerabilities of ASP.NET web applications and saw that most of these can be fixed by making some configuration change or minor code changes.


Build full-featured business apps for any browser with Infragistics ASP.NET controls! Download Free Trial now.


The Importance of Prose in Communicating Data

$
0
0

If you're a data communicator, having a good understanding of chart and table design is important. Thankfully, the art and science of creating effective charts and tables is the subject of a great number of books. (One of my favorites is Stephen Few's Show Me the Numbers.) This doesn't, however, mean that how we use ordinary prose - spoken or written - should be ignored.

About a year ago I wrote an article here titled "7 Do's and Don't of Dataviz". The first of those seven things was "Don’t use a chart when a sentence will do". Ryan Sleeper takes the opposing view in this article:: "Even when the numbers are in units, you can likely tell that the first number is smaller than the second number, but it is challenging to consider the scale of the difference."

I'm not convinced by this argument for written text if the numbers are formatted consistently, with commas (or points) as thousand separators. The varying number of digits and separators make it fairly obvious when numbers differ by a couple of orders of magnitude. (Aside: this is also why you should right-align numbers in tables (or align on the decimal point where possible and applicable).)

Better still, with written prose we can be explicit about large differences: "Value 1 (4,500,000) is 150 times larger than value 2 (30,000)." In a single sentence we have expressed a pair of values precisely and provided a simple comparison that is really easy to understand: the first entity is 150 times the size of the second.

Even if you don't like the use of parentheses or you don't want to type out all the 0's in 4,500,000 there are plenty of other ways to create a sentence that clearly conveys the difference between two very different numbers. In most cases you'll probably be looking at real entities or concepts rather than completely abstract numbers so we'll imagine a scenario: "With a salary of $30,000, Bob would have to work for 150 years to earn the $4.5 million that Aaron earns in just one twelve-month period." While you can see there's a massive difference between the wages of Aaron and Bob in the bar chart below, it's pretty tough to get the factor of 150 from comparing the lengths or end-points of the bars alone. You might think "Wow, Aaron earns a lot more than Bob" but you're unlikely to get the bit where it'd take Bob a century and a half to earn as much.

Of course, neither the descriptive sentence nor the bar chart tell us anything about why Aaron earns so much or why Bob's salary is more modest. Neither really tells us why we should care either. Two numbers are different. So what?

Well there might be a good story in the difference. They could be twins or friends who made slightly different life choices with huge consequences. Or we could "just" be comparing a company CEO and someone further down the company's pyramid. As I keep saying, context is key when it comes to conveying data. Even if you really insist that your two data points require a chart, chances are that to convey the proper context and make a real impact you'll need to provide some descriptive information that doesn't have a natural chart form. So it makes sense to take some time to think about prose whether you listen to my earlier advice or not.

I'm not saying we can't enhance charts by adding more visual cues that help with context, if we have relevant information available. The chart below is the same as above except with a reference line for the median salary for the made-up company I've decided they work for. Now we can see that Bob's salary is much closer to the median than Aaron's (as you might expect).

Let's try to put the salient details from the chart above in a sentence or two: "Bob's salary of $30,000 is 80% of the company median of $37,500; he would have to work for 150 years to earn the $4.5 million that Aaron earns in just one twelve-month period." From this we learn precisely what Bob's salary is, how Bob's salary compares to the median, precisely what the median is, how Bob's salary compares to Aaron's salary and what Aaron's salary is. The only information we're not given directly is how Aaron's salary compares to the median. But since we know Bob's salary is similar to the median but two orders of magnitude less than the Aaron's, it should be fairly evident that Aaron's salary is two orders of magnitude greater than the median.

Using prose to communicate data effectively isn't just about picking the right number formatting and sentence structure. You also need to use the right units for your audience: I could tell you that the Andromeda galaxy is about 780 kiloparsecs away, but unless you've taken an astronomy course you're unlikely to feel better informed. If I told you it was two and a half million light years from Earth you might at least be inclined to think "oh, that's a really long way". More people will understand that light travels a long way in a year than will know that a parsec is the distance at which the mean radius of the Earth's orbit subtends an angle of one arcsecond and that a kiloparsec is a thousand times that distance. Don't be afraid to use unusual units of measurement, perhaps alongside conventional ones, to provide context when you expect your audience will lack domain expertise.

Take the time to think about how best to express your key values, which set of units to express them in and how to make comparisons easier. Turn to charts when you have something important to convey that can't be said in a few words and when you want to highlight patterns, trends and differences rather than provide precise values (where a table should be used instead). Whichever option you go for, remember to provide context.

Try one of our most wanted features - the new XAML 3D Surface Chart and deliver fast, visually appealing and customizable 3D surface visualizations! Download Infragistics WPF 16.1 toolset from here.

Why you need a Silverlight Migration Strategy

$
0
0

It’s been nearly ten years since the dawn of Silverlight’s release. In late 2015 the Microsoft team announced for it’s latest version, Silverlight 5, a road-map which includes a projected time-frame to maintain support - effective through 2021.

Silverlight’s official road-map

Microsoft Edge, Google Chrome, and Safari no longer support Silverlight, Mozilla Firefox will discontinue support for Silverlight within the next year.

Compatible Operating Systems and Browsers

Things to take into consideration when planning a Silverlight migration strategy:

Here are some questions you may be asking yourself:

1. Am I ready for HTML 5, or other technologies?
2. I’m ready but where do I begin?
3. How long can I maintain our Silverlight apps?
4. Which applications are capable of migrating? Which applications are not feasible?
5. Is there a demand for it? (e.g. End-users seeking new features)
6. Would I be willing to support older browsers? (eg. justify supporting a plug-in due to its maturity)

It is vital to have access to the latest tools, the right tools, to get the job done and exceed expectations for your next application. 

Establishing a migration strategy will lay the ground work and stand as a blueprint for new and existing projects. You should begin planning what platform you will migrate to as soon as possible as that decision will save you time, energy and resources.

You need a plan that's easy for you and your team to follow. Whether you decide to move to HTML 5 with Angular or another platform, having a strategy will ensure a seamless migration so that their business and personal core values are met with minimal amount of downtime.

Technological advancements help evolve the methods of building great software and change is inevitable. But change can happen gradually. It's important to have sound strategy; so that it will help you make the right choices and build new and exciting experiences.

Download and try Ignite UI: jQuery/HTML 5

IGNITE UI 2016 VOL. 1 PLATFORM INSTALLER

Viewing all 2372 articles
Browse latest View live


Latest Images