Quantcast
Channel: Infragistics Community
Viewing all 2398 articles
Browse latest View live

What to expect in an interview for a .NET job

$
0
0

Around the world there is an urgent need for skilled developers. Even Barack Obama told us that the world needs developers and that kids should start learning programming skills as soon as possible. However, attending a job interview can be a nerve wracking experience and so in this post, we’ll look at what a .NET developer can expect in an interview and how they can prepare.

Many talented developers find they have difficulties with job interviews because they tend to be too focused on what they are passionate about - that is, technology and development - and not on the preparation of their interview skills. Preparing for a job interview can really help boost your career by giving you opportunities you wouldn't get otherwise.

Make your CV stand out

Generally speaking, your biggest chance of getting job interview starts when employers scan your resume. This is an opportunity you simply can’t afford to slip up on. A skilled developer is not a professional resume writer, so to get the largest number of possible opportunities for an interview it is fair to spend some money having your resume improved by an expert. This is a small investment to make for the potential gain of landing a much better job.

Know your CV!

Many interviews begin with a discussion of your CV and experiences. However, a common mistake employers report is that interviewees often seem not to know their own resume. Nothing will make alarm bells ring like a candidate who has a lot of trouble explaining what they’ve done previously. So, make sure you know what you wrote and can speak about what you did when and where.

It’s also essential to be able to provide examples about specific situations, problems or issues. Interviewers often want to know how you’ve dealt with difficult moments, communication problems, heavy workloads and want to hear examples of your successful projects. Think about your experiences before the interview and think how you would explain what you did and what the result of your actions were.

Besides describing your professional and academic successes, it’s also good practice to research the interviewer. It takes only a few minutes to Google this person and read a few blog posts he or she wrote. Show interest in the interviewer by mentioning a blogpost or an article they’ve written or shared. The easiest way to get someone interested in you is to show a genuine interest in them.

A testing experience

In most interviews, the developer needs to solve some algorithm based problems like explaining a sorting algorithm, solving an exercise with arrays or optimising a routine. These questions are intended to test your problem solving skills. It doesn't matter what programming language or technology you use, if you can solve problems, you will be a good developer. Problem solving is the base skill of good software development.

There are some basic steps in solving these kind of problems:

  • Identify the problem
  • List the possible solutions or actions
  • Weigh the possible solutions
  • Choose one solution to try
  • Put the solution into practice
  • Evaluate the solution

What’s your motivation?

During your conversation, the interviewer will check if you can answer questions with passion. Showing a real interest in what you do is important in every job. A carpenter that hates cutting wood is a bad carpenter. A developer should love doing their job and this must be clear when answering questions.

Questions you can expect will be like "why are you a developer?" or "why would you write a web application". Rather than giving a straight technical answer, emphasise that you what you love doing is developing and writing code. Speak about the satisfaction you get from a good build and about how it’s been your dream since you first begun playing with computers.

Getting technical 

Most developer interviews will involve a technical section. You can expect this to check your knowledge of design patterns and practices. Design patterns are general reusable solutions to a commonly occurring problem within a given context in software design. You’re likely to hear questions like:

  • What is an interface?
  • Explain the Facade pattern.
  • Write a singleton class

These questions are programming language independent and gives the developer the chance to show that he or she know the developer basics. Spend some time thinking about how you’d answer this kind of question and remember your answers; your interviewer will be impressed if you can reel off correct explanations without thinking too much.

Besides the general development questions like algorithms and patterns the interviewer will also check your knowledge of the .NET architecture. Questions might include:

  • What is the garbage collector?
  • What is the difference between Webforms and MVC?
  • Explain the lifecycle of an aspx page.

These questions are programming language independent also so try to answer them in an independant way to show the interviewer that you really know the complete framework. When asked you can go language specific by using C# (or any other language) to explain your solution.

Any good developer solves problems in a language independent way and knows that a language can be easily adapted. Of course it is an advantage to be a real expert in, for example, C# but do not get hung up on it. Know that there are other languages out there and know how to use them and show willing to learn them.

Preparation, preparation, preparation

Doing a job interview as a developer need not be a nerve wracking experience. 90% of the interview can be prepared in advance. Make sure you know the company, the job description and the interviewer. Refresh your problem solving algorithmic skills, list the common patterns you know and try to explain them and at last learn the ins and outs of the .NET framework.

Good luck!


11 Things About JavaScript Functions that .NET Developers Should Know: Part 1

$
0
0

I have often seen .NET developers struggle with JavaScript. They try to compare C# functions with JavaScript functions and usually make some minor but conceptual mistakes while using it. We can all agree that JavaScript functions are the backbone of the JavaScript programming language, and if one has a good understanding of the function, then using JavaScript is easier. So in this two parts series, I will focus some important concepts of JavaScript functions.

In this part of the series, we will cover the following six topics:

  1. JavaScript functions as an expression
  2. JavaScript functions as a statement
  3. Return statements in JavaScript functions
  4. Parameters in JavaScript functions
  5. The Arguments object in JavaScript functions
  6. Varargs JavaScript functions

JavaScript functions can be an expression

A JavaScript function can be an expression, as seen below:

var add =function Add(num1, num2){var result = num1 + num2;return result;};
 

A function expression creates an instance of the function object. It can be passed as an argument to a function, it can be returned from a function, and it can be assigned to a variable or an array. A function expression can be created with the name as shown here:

var add =function Add(num1, num2){var result = num1 + num2;return result;};var s = add(34,67);
console.log(s);

A function expression can be created without the name as shown here:

varsub=function(num1, num2){var result = num1 - num2;return result;};var r =sub(5,9);
console.log(r);


We cannot use a function expression before it has been created. So if in above code snippet, we call the sub function before it’s created as shown below:

var s =sub(34,67);
console.log(s);varsub=function(num1, num2){var result = num1 - num2;return result;};
 

We will get an exception as shown below:

To understand why we are getting the above exception, let’s try to understand how var works in the JavaScript. When you assign something to var using an assignment, JavaScript first creates var on the top of the function with the value undefined in it. Essentially var statements get converted in two parts. For every var, at the top of the function, JavaScript will create a variable with undefined value assigned to it. Later the real value will be assigned to the variable.

This is the reason when we try to invoke a function expression before it was created, we got the exception that undefined is not a function.

JavaScript functions can be a statement

A JavaScript function can be created as a statement too, as shown below:

function Factorial(n){if(n <=1){return1;}return n * Factorial(n -1);}

When we create a JavaScript function as statement, it is mandatory to give a name to the function. When we create a function statement, JavaScript creates an object and assigns that to the variable. So usually, when you create a function statement, JavaScript creates a variable with the same name as the function. Unlike the function expression, a function statement can be invoked before it is defined. As you see below, the code will not throw any exceptions.

var result = Add(9,8);
console.log(result);function Add(num1, num2){return num1 + num2;}
 

Function statements are moved to the top of the script, so they can be invoked before they are defined.

Return statements in JavaScript functions

A JavaScript function may or may not have a return statement. By default, a JavaScript function returns value undefined. Explicitly you can return an expression from the JavaScript function. If there is no expression, then the JavaScript function is returned as undefined.

We have seen that the JavaScript function can return an expression as shown below:

function Add(num1, num2){return num1 + num2;}var result = Add(1,2);
console.log(result);
 

And you can also have a JavaScript function without a return statement as shown below:

function Foo(){// function body }var result = Foo();
console.log(result);

The value undefined will be printed on the console because the JavaScript function does not return any value. Another scenario may give you an expressionless return statement in the function. In this case an undefined value will also be returned from the JavaScript function. The function defined below will also return an undefined value.

function Foo(){// function body return;}var result = Foo();
console.log(result);
 

Keep in mind that a JavaScript function constructor, by default, returns the invoking object; not the undefined value.

Parameters in JavaScript functions

JavaScript does not:

  1. Type-check the parameters
  2. Check the number of parameters being passed

However, you can essentially pass any type or number of parameters in a JavaScript function. You can pass fewer parameters than declared or more parameters than declared, and when you invoke a function with less parameters than are declared, the additional parameter values are set to undefined. Let’s see this in action.

Here we have a JavaScript function Add which takes two parameters. However, we are passing only one parameter while invoking the function:

function Add(num1, num2){
    console.log(arguments.length);
    console.log(arguments[0]);
    console.log(arguments[1]);var result = num1 + num2;return result;}var result = Add(8);
console.log(result);
 

As a result, you will see that arguments.length prints 1 and arguments[1] prints undefined, so you can pass less parameters than declared parameters. Additional parameters will have an undefined value. Note: we will discuss the arguments object in my next post.

On the other hand, you can pass more parameters than there are declared, and you can access those additional parameters using the arguments object. There is no way you can refer to additional parameters with a named argument; you can access it only using the arguments object:

function Add(num1, num2){var result = num1 + num2 +arguments[2];return result;}var result = Add(8,9,10);
console.log(result);
 

As the output of the above snippet, you will get 27 printed. JavaScript functions support a variable number of parameters. By default, it will pass undefined for all parameters whose value is not passed, and will simply ignore any additional parameters passed.

The arguments object in JavaScript functions

When we invoke a JavaScript function, along with parameters, the arguments object also gets passed to the function. Let us consider the Add function as defined below:

function Add(num1, num2){
    console.log(arguments.length);return num1 + num2;}var result = Add(1,2);
console.log(result);
 

As you’ll see, inside the Add function, we are printing length of the arguments. Since we are passing two parameters to the function, 2 will be printed for the length of the arguments object. In JavaScript, along with the parameters, the arguments object also gets passed. It allows us to access the parameters with the number rather than the parameter’s name. Using the arguments object, the Add function can be rewritten as shown below, and it will print the exact output.

function Add(num1, num2){
    console.log(arguments.length);returnarguments[0]+arguments[1];}var result = Add(1,2);
console.log(result);
 

The arguments is an array-like object, but it is not a JavaScript array. Any JavaScript array operations on the arguments object will throw an exception. For example, the push and pop method will throw exception. It’s very likely that the code snippet below will throw an exception because that object does not have a pop or push method.

function Add(num1, num2){
    console.log(arguments.length);var a =arguments.pop();arguments.push(45);returnarguments[0]+arguments[1];}var result = Add(1,2);
console.log(result);
 

You can use the arguments object to throw an exception when the user does not pass the expected number of parameters. Let’s say in the add function, you want to throw an exception when users pass less or more than two parameters while invoking the function. This can be done using the arguments object as listed below:

function Add(num1, num2){if(arguments.length !=2){thrownew Error("Pass exactly two parameters");}return num1+num2;}var result = Add(1,2,3);
console.log(result);
 

The arguments object is very useful to fetch additional parameters being passed and restricted to invoke the function with specified numbers of parameters.

Varargs JavaScript function

Varargs functions are those functions which work on any number of parameters. Using the arguments object, all the passed parameters can be iterated and used. Let’s consider the listing shown below, where the add function takes a variable number of parameters and returns a summation of all the passed parameters:

function Add(/* pass any number of parameters */){var sum =0;for(var i =0; i <arguments.length; i++){
        sum = sum +arguments[i];}return sum;}var result = Add(7,8,9);
console.log(result);var result1 = Add(5,6,78,93,5);
console.log(result1);
 

In the Add function, we are passing a different set of parameters and using the arguments object, adding the passed parameters and returning the summation. The Add function is a varargs JavaScript function.

Summary

In this part of the series, we covered the following six topics:

  1. JavaScript functions as an expression
  2. JavaScript functions as a statement
  3. Return statements in JavaScript functions
  4. Parameters in JavaScript functions
  5. The Arguments object in JavaScript functions
  6. Varargs JavaScript functions

The topics we’ve discussed here are vital when using JavaScript functions, and in the next part of this series we’ll cover invocation patterns, high level functions and more.

Five Facts About the Office 365 API

$
0
0

An API is a set of protocols with which a developer can interface with a given system or platform. Late last year Microsoft released the long awaited APIs for Office 365, finally giving developers a standard way to customize the popular collaboration platform. See here for a good overview from the MSDN site on the various ways you can now develop for the Office 365 platform.

For example, it is possible to write a HTML5 and JavaScript based website that reads data from Office 365 and displays it to users. Or you can build a Windows 8 Universal App, which pulls data from a SharePoint Tasks list stored inside SharePoint Online. The possibilities are (almost) endless!

Microsoft is actively encouraging developers to think of Office 365 as a platform and to create awesome applications on a variety of platforms. The recently relaunched Office Dev Center is testament to this.

In this post, we'll look at five interesting or unique ways that the Office 365 API can be used.

1. Build an E-mail app for Android, integrating with Yammer and OneDrive

How cool would it be to see documents, Yammer discussions, and e-mail all in one single application? The Office 365 API makes this possible, and even on Android.

This app could allow users to read their e-mails, see the discussions from Yammer, and access documents stored in OneDrive, all from one single screen. Content could be mapped to themes, metadata, or search results, meaning everything is shown with a much greater level of context. Yammer has proved very successful for Office 365 so far, so putting its data inside an email based app would be very interesting indeed.

2. A custom Intranet app for mobile devices

While Office 365 has a great native mobile view, accessing over the web isn’t the best approach for everyone. Various Microsoft and third party apps exist, including our own, but these can’t always be easily modified and branded. By creating a mobile app, specific for the company's own Office 365 Intranet, users can access a totally bespoke version of the Intranet on the move.

The app could feature a unique user interface that pulls out the features that are important and relevant to that organization, highlighting key aspects or data. Such an option would have a cost impact, but for large scale deployments and systems it could pay real dividends.

3. Chrome extension to enrich content Office 365 content

It would be really interesting if data found on different websites, as people browsed throughout the day, could be enriched with company specific data from Office 365. A Chrome extension is one way to do this.

For example, when Googling for a certain query, this query can be fired against the Office 365 search as well and displayed next to the Google results. Or, when the extension detects the name of an employee, it shows data stored in Office 365 for that person.

4. Make updating or completing tasks fun

Many people work to complete tasks all day, often in SharePoint and Office 366. But a common problem is people tend to forget to update a task once they have worked on it.

To make this process more fun, it could be transformed into a game, developed as a Windows 8.1 or mobile app. People love games and gamification is very popular in enterprise tools. Achievements and rewards can be found in almost any game. Why not bring that to the workplace?

Leaderboards and achievements can be implemented as part of project tasks lists; every time a user completes or updates a task, he gets an achievement. When a user ranks first during a week, he or she can be rewarded sufficiently - a free lunch or coffee. People can track their progress using the app. Going to Office 365 to update a task becomes rewarding, and much more fun!

5. A Windows 8.1 app to work offline with Office 365

Office 365 has one obvious drawback. Like all cloud software it requires a working Internet connection. So users on the move, away from a network connection, or otherwise offline have limited options to stay productive. So, building an app that synchronizes certain data while connected, and provide an offline mode while disconnected, allows the user to work even without a network connection. OneDrive does a good job of this for documents, but an enterprising developer could put together something pulling in a whole raft of Office 365 content.

A world of possibilities

These five ideas presented are just the tip of the iceberg, and there is a whole host of other unique ways the new Office 365 APIs can be put to good use. As we touched on earlier, Microsoft is putting a lot of effort in documentation and guidelines to help the developer community. So be sure to check out the Office Dev Center and our own tools, and get creating!

Using the xamTabControl as a Prism Region and Closing Tab Items

$
0
0

The Microsoft TabControl is a popular control to use as a region in a WPF Prism application.  Unfortunately, the Microsoft TabControl comes with some limitations, such as the inability to close tab items.  If you want to close tab items in the Microsoft TabControl, you need to implement this functionality yourself.  However, you can make this easy on yourself by using the Infragistics xamTabControl.  The xamTabControl extends the Microsoft TabControl and adds a number of features that you would normally have to write yourself otherwise.  For example; closing tab items is built into the control.  Another great thing is that nothing syntactically really changes when you use the xamTabControl as a Prism Region.  So switching out the TabControl for the Infragistics xamTabControl is no big deal.  Everything is the same.

Let’s take a look at a view that uses the xamTabControl as a region and adds support for closing tab items.

<Window.Resources>
    <Style TargetType="{x:Type igWPF:TabItemEx}">
        <Setter Property="Header" Value="{Binding DataContext.Title}" />
    Style>
Window.Resources>

<Grid>
    <Grid.RowDefinitions>
        <RowDefinition Height="Auto" />
        <RowDefinition Height="*" />
    Grid.RowDefinitions>

    <StackPanel Orientation="Horizontal">
        <Button Command="{Binding NavigateCommand}" CommandParameter="ViewA" Content="Navigate A"/>
        <Button Command="{Binding NavigateCommand}" CommandParameter="ViewB" Content="Navigate B"/>
    StackPanel>

    <igWPF:XamTabControl Grid.Row="1" prism:RegionManager.RegionName="TabRegion" />

Grid>

As you can see, this is a very simple view.  It uses the xamTabControl as it’s region and it also has a couple of buttons on it that we will use to navigate to different views in the xamTabControl region.  So when you run the application and click the buttons a couple of times, you will end up with something like this:

image

Okay, it’s nothing special right now.  It looks just like it did if we were to use the Microsoft TabControl.  Now let’s say we want to add support for closing tab items.  Well, no problem!  This is as easy as using a property.  The TabItemCloseButtonVisibility property to be exact.


<igWPF:XamTabControl Grid.Row="1" prism:RegionManager.RegionName="TabRegion" TabItemCloseButtonVisibility="Visible" />


Run the application and now we get those cool little close buttons automatically.

xamtabcontrol-as-prism-region

Pretty cool right?  Heck yeah it’s cool!  Run the app and start opening and closing tabs until your heart’s content.  But……  We actually have a major issue here.  We are using Prism.  We have this thing called a Region.  This region holds all of the views we add to it until we remove them from the region.  Unfortunately, when you click on that pretty little close button, the view seems to be removed from the control, but in actuality it is still hanging around in our Region.  This is because the close button has no idea that we are using Prism, or that we need to remove the view we just closed form the Region.

Solution

So how do we fix this?  Simple… we need a custom behavior.  This one right here:

publicclassTabItemRemoveBehavior : Behavior<XamTabControl>
{
    protectedoverridevoid OnAttached()
    {
        base.OnAttached();
        AssociatedObject.AddHandler(TabItemEx.ClosingEvent, newRoutedEventHandler(TabItem_Closing));
        AssociatedObject.AddHandler(TabItemEx.ClosedEvent, newRoutedEventHandler(TabItem_Closed));
    }

    protectedoverridevoid OnDetaching()
    {
        base.OnDetaching();
        AssociatedObject.RemoveHandler(TabItemEx.ClosingEvent, newRoutedEventHandler(TabItem_Closing));
        AssociatedObject.RemoveHandler(TabItemEx.ClosedEvent, newRoutedEventHandler(TabItem_Closed));
    }

    void TabItem_Closing(object sender, RoutedEventArgs e)
    {
        IRegion region = RegionManager.GetObservableRegion(AssociatedObject).Value;
        if (region == null)
            return;

        var args = (TabClosingEventArgs)e;

        args.Cancel = !CanRemoveItem(GetItemFromTabItem(args.OriginalSource), region);
    }

    void TabItem_Closed(object sender, RoutedEventArgs e)
    {
        IRegion region = RegionManager.GetObservableRegion(AssociatedObject).Value;
        if (region == null)
            return;

        RemoveItemFromRegion(GetItemFromTabItem(e.OriginalSource), region);
    }

    object GetItemFromTabItem(object source)
    {
        var tabItem = source asTabItemEx;
        if (tabItem == null)
            returnnull;

        return tabItem.Content;
    }

    bool CanRemoveItem(object item, IRegion region)
    {
        bool canRemove = true;

        var context = newNavigationContext(region.NavigationService, null);

        var confirmRequestItem = item asIConfirmNavigationRequest;
        if (confirmRequestItem != null)
        {
            confirmRequestItem.ConfirmNavigationRequest(context, result =>
            {
                canRemove = result;
            });
        }

        FrameworkElement frameworkElement = item asFrameworkElement;
        if (frameworkElement != null&& canRemove)
        {
            IConfirmNavigationRequest confirmRequestDataContext = frameworkElement.DataContext asIConfirmNavigationRequest;
            if (confirmRequestDataContext != null)
            {
                confirmRequestDataContext.ConfirmNavigationRequest(context, result =>
                {
                    canRemove = result;
                });
            }
        }

        return canRemove;
    }

    void RemoveItemFromRegion(object item, IRegion region)
    {
        var context = newNavigationContext(region.NavigationService, null);

        InvokeOnNavigatedFrom(item, context);

        region.Remove(item);
    }

    void InvokeOnNavigatedFrom(object item, NavigationContext navigationContext)
    {
        var navigationAwareItem = item asINavigationAware;
        if (navigationAwareItem != null)
        {
            navigationAwareItem.OnNavigatedFrom(navigationContext);
        }

        FrameworkElement frameworkElement = item asFrameworkElement;
        if (frameworkElement != null)
        {
            INavigationAware navigationAwareDataContext = frameworkElement.DataContext asINavigationAware;
            if (navigationAwareDataContext != null)
            {
                navigationAwareDataContext.OnNavigatedFrom(navigationContext);
            }
        }
    }
}

Now simply apply the Behavior to our xamTabControl by using System.Windows.Interactivity.  Like so:

<igWPF:XamTabControl Grid.Row="1" prism:RegionManager.RegionName="TabRegion" TabItemCloseButtonVisibility="Visible" >
    <i:Interaction.Behaviors>
        <core:TabItemRemoveBehavior />
    i:Interaction.Behaviors>
igWPF:XamTabControl>

What this Behavior does is hooks into the TabItemEx.Closing and TabItemEx.Closed events so that we can execute our Prism logic during the tab item closing process.  First, we need to respect whether we can even close the tab.  This is done by checking the IConfirmNavigationRequest interface on the view we are trying to remove in the Closing event.  If our View or ViewModel returns false during the ConfirmNavigationRequest method call, then the tab item cannot be closed.  Otherwise, we will allow the tab item to be closed.  For example; let’s say I had some rule that wouldn’t allow ViewB to be closed.  I simply pass “false” in the continuationCallback within the ConfirmNavigationRequest method, and prompt the user letting them know why this tab couldn’t be closed.

image

This bring us to the TabItemEx.Closed event.  Now that we know if we can or cannot close a tab, we simply get the view from the tab item, and then remove it from the region.  But, before we remove it, we want to invoke the NavigatedFrom method on the INavigationAware interface so that we can respond to when a tab is closed from within our View or ViewModel to do any last minute clean up or state management.

That’s it!  You have now added complete Prism Navigation support for closing tab items when using the xamTabControl as a Prism region.  Hopefully you will find this useful, and maybe even use this in your WPF Prism applications.  Be sure to check out the source code, and start playing with it.  As always, feel free contact me on my blog, connect with me on Twitter (@brianlagunas), or leave a comment below for any questions or comments you may have.

How to use NodeJS, Express, and Bower to Create AngularJS apps

$
0
0

Recently I heard someone say that “IDE makes you ignorant, so don’t rely on it”. The thought behind this is that as .NET developers, we cannot think of life beyond Visual Studio, so we become ignorant and don’t care about the behind the scenes complexities. We create a project by selecting a specific project template and manage the different required packages using the NuGet package manager. Super simple, right? Well, not necessarily.

In this article, we’ll explore another way to create an application using JavaScript at the server and at the client, by having NodeJS run it on the server and Angular run it on the client.

Note: Image taken from the web. A special thanks to original image creator.

We will start with creating an angular application in Visual Studio, and then proceed to create the same Angular application using a few components of the MEAN stack: NodeJS, Express, and Bower. Specifically, this post will cover the following topics:

  • Creating an AngularJS application in Visual Studio
  • Installing NodeJS on Windows
  • Setting up the sublime text for JavaScript development
  • Installing Bower
  • Installing Angular dependencies using Bower
  • Creating an Angular application
  • Installing Express
  • Creating a web server using Express to serve the Angular app

Creating an AngularJS application in Visual Studio

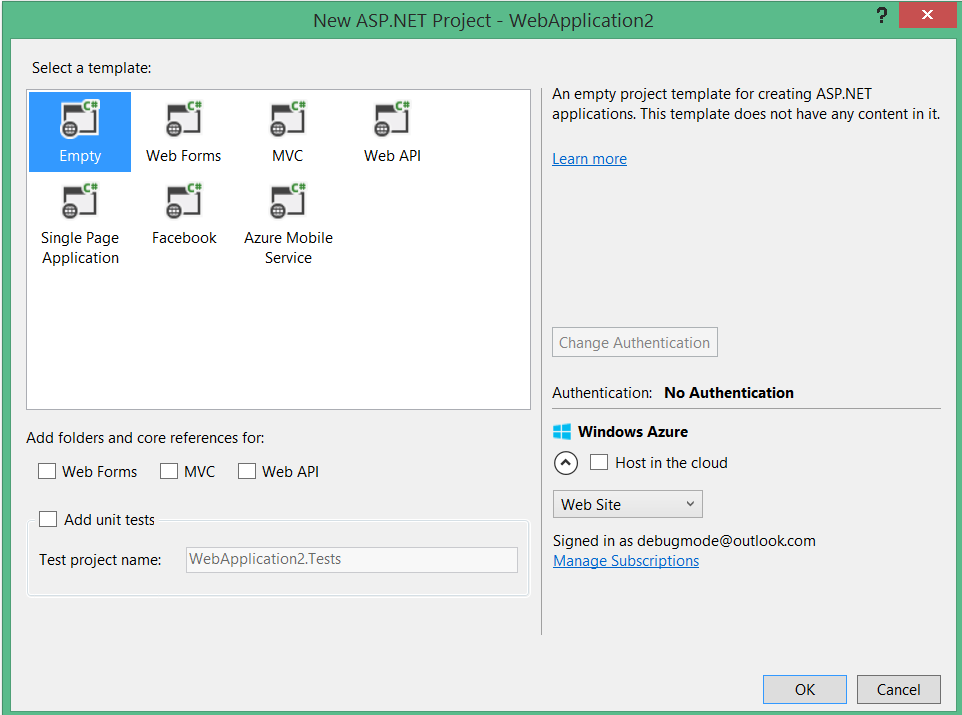
We can create an AngularJS app in Visual Studio by going to File-New Project and then selecting ASP.NET Web Application project template from the Web tab. We are going to create an AngularJS application running on IIS express, so we will choose the Empty template.

I am using Visual Studio 2013 for the purpose of this blog. Once the project is created, we can add an Angular library using the NuGet package manager.

After successful installation of the Angular library you can see Angular files in the Scripts folder of the project.


We are all set to write the first AngularJS app using Visual Studio. Let’s go ahead and add an HTML file and the required reference on that to write our first Angular app. In the image below you’ll see that I’ve added Index.html, a reference to the Aangular library, and I’ve created a simple app as shown below:


On F5, the Angular app will run in ISS Express, which is Visual Studio’s default web server. We should see the application as it appears below:

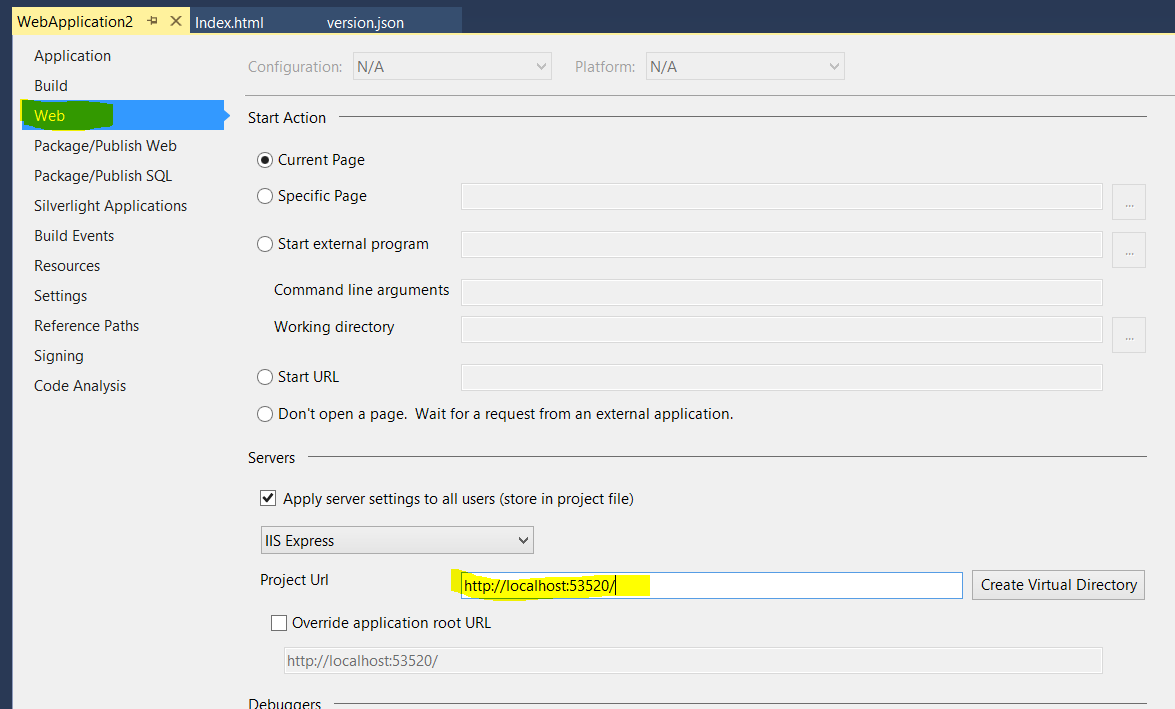
Right now, our application is running on the local host and at port 53520. Very easily, we can configure the port number by right clicking on the project, and from the context menu in the web tab, we can edit the Project Url as shown below:


As you can see, using Visual Studio, it’s very simple to create an Angular app. Like I mentioned earlier in this post, the use of IDE sometimes makes us ignorant - many complexities have been taken care of by Visual Studio so that we don’t even have to think about them. For us, writing an Angular app was very easy.

Okay, but now how do I create an Angular App on Windows without Visual Studio?

There are many ways to create an Angular app on Windows without using Visual Studio - or any IDE for that matter.  Next I’m going to show you how an Angular app can be created using:

  • NodeJS as the web server
  • Bower to install any client side dependencies
  • Sublime text as the code editor

Install NodeJS

We’ll start by installing NodeJS on Windows. To do that, navigate to http://nodejs.org/ and click on INSTALL to get an MSI file to be installed on Windows. Make sure that the NodeJS variable has been added to the environment variable of windows. To verify that NodeJS installed successfully, open the command prompt and type the command node. Then you’ll get a node shell in which you can run JavaScript code:


Configure SublimeText for JavaScript development

After successfully installing NodeJS, let’s configure Sublime Text for the JavaScript development. To do this we need to create a build system for the JavaScript in Sublime Text. To create the build, in Sublime Text navigate to Tools->Build Systems->New Build System, and enter the code as shown below:


After saving the file, you will find a build for JavaScript in Tool->Build System. You’ll need to select that to perform JavaScript development. After selecting the JavaScript build, in Sublime Text you can run JavaScript by using Ctrl+B.

Creating an Application folder and using Bower to install Angular dependency

As of now we have set up NodeJS and Sublime Text. Now we need to install bower. Using Bower we can manage all of the client side dependencies. To do that, let’s create a new folder on the file system and install Bower inside that. In my case, I’ve created a folder named HelloWorld2. In the newly created folder, first run the following command: npm init

This command will ask you few questions, but if you’re unsure of any answers, simply leave the default value there. This command will create a file named package.json in the folder.  

Next run the command npm –nstall –g bower to install Bower as shown in the image below:

After successful installation of Bower, we need to install all Angular dependencies. These can be installed by executing the command bower install angular.


After successfully installing the command, you will find a subfolder named bower components. Inside the bower_components sub folder, you will find an Angular folder. This folder will contain all the required Angular files.

As of now, we have installed NodeJS, Sublime Text and we’re using the Bower-required Angular dependencies. Now let’s go inside the root folder (the folder we created in the previous step) and create a file named Index.html. To do this, let’s add a folder to the project by clicking Project-> Add Folder to Project and add the HelloWorld2 folder we created in the previous step.

Once that folder is added to the project, you can find that in the left of the Sublime text.


Right click on HelloWorld2 and create a new file, press Ctrl+S to save it, and name it as Index.html:

In Index.html, we will add the reference to Angular and create an Angular application.

Installing Express

So far we’ve created the Angular application using NodeJS and Bower. Now we need a web server to serve HTML, CSS and JavaScript. In this step we’ll create a simple web server using Express. We can install Express using npm install express. Run the command as such:

npm install express --save

After successful installation of Express, you will find that package.json has been updated as shown here:

Next add a file server.js in the root of the folder.

As you’ll see in the code, Express will serve files from the root directory and then the app subdirectory. So make sure to put the Angular app file and Bower components file inside the app subfolder. Your folder structure should more or less look like this:

Next, go ahead and run the node application using the node command. Run the command node server.js  - this will start the server on port 1001:

Now we can run the Angular application using the web server created using Express on port 10001.

Now we have an Angular application running on the web server, using JavaScript on the server and at the client!

I hope this article will help you in getting started with the MEAN stack - and help you realize that using open source is not as tough as it seems!

Developer News - What's IN with the Infragistics Community? (1/26-2/1)

$
0
0

The last Developer News of January has some awesome articles, ranging from a podcast roundup to testing tips for Java developers. Take a look at what's hot and see if you have anything to add.

5. Top 5 Podcasts for .NET Devs (.NET Zone)

4. Internet of Things: What About C# There? (MSDN Blogs)

3. Technical Leadership for Agile Teams (InfoQ)

2. Using Grunt.js to Merge and Minify Javascript files in an ASPNET MVC Application (DotNetCurry)

1. Top Testing Tips for Discriminating Java Developers (ZeroTurnAround)

No more NPAPI support for Chrome: What are the alternatives?

$
0
0

As of January 2015 Chrome will be effectively dropping support for NPAPI, rendering it more or less obsolete. Google announced they would be phasing out the plugin in September 2013 and over the last fifteen months have been gradually reducing support on their browser, while simultaneously making it harder for developers to build components with it.

The Internet is constantly evolving and, according to Google, NPAPI was well past its sell by date. Blamed for hangs, vulnerable to threats and overtaken by more sophisticated APIs, NPAPI seems to have had its day. Some developers have been less than impressed by Google’s decision, citing specific programming tools that still depend on NPAPI, the potential problems around different browsers using different APIs and the general critique of the ‘Corporation as a behemoth crushing diversity’. Nonetheless, the vast majority of developers have already moved on from NPAPI, and Chrome supports a number of alternative extensions to fill in the gaps.

In this blog we’ll be taking a longer look at support for NPAPI, why Google is dropping it, and what alternatives are out there.

Not happy with NPAPI

NPAPI was developed for Netscape in the 1990s to allow users to run unusual files (such as video and audio) within their browsers without having to open them on a third platform. Quickly adopted by all major browsers, the plugin has more recently been made redundant by HMTL5, thanks to the code’s ability to play media without the help of a plugin. The big three web browsers have now dropped NPAPI plugins - first was Internet Explorer (which only ever partially adopted it) more recently followed by Mozilla and now Chrome.

In their September 2013 announcement, Google explained that they’d seen a steady decline in use of the plug-in, pointing out that only six NPAPI plugins had been used by more than five percent of users in the previous month and reiterated its decreasing utility:

“Today’s browsers are speedier, safer, and more capable than their ancestors. Meanwhile, NPAPI’s 90s-era architecture has become a leading cause of hangs, crashes, security incidents, and code complexity.”(Emil Protalinski)

Google has been hammering nails into the coffin ever since. The phase out schedule began with blocking the addition of new NPAPI supported apps on the Chrome Web store, rendering it more difficult to use apps supported by NPAPI and discouraging development. From April 2014 all NPAPI supported apps where unpublished from the webstore (although earlier purchases continued to function).

Google did produce an official whitelist of the most popular NPAPI plugins which would be spared the chop until January 2015 which included:

  • Silverlight (launched by 15 percent of Chrome users in the month to September 2013)
  • Unity (9.1 percent)
  • Google Earth (9.1 percent)
  • Java (8.9 percent, but already blocked for security reasons)
  • Google Talk (8.7 percent)
  • Facebook Video (6.0 percent)

Beyond this original list, Google also allowed developers to add their own apps to the whitelist for the sake of ongoing projects. While new NPAPI apps are now blocked on Chrome, support will remain for developers making the last minute transition away from the plugin. However, in April support will be totally dropped and it will be impossible to use installed extensions with the plugin by September 2015.

So, what now?

Recognizing developer’s concerns about installed extensions, Chrome has handily provided details on alternatives to NPAPI in their blog. By and large, HTML, CSS and JS will continue to be the main tools in the developer’s sandbox, fulfilling most coding needs. Meanwhile, HTML5 was designed to bypass the risks inherent in plugins by allowing developers to include video and music files within code (rather than as an add-on). HTML5 avoids many of the risks posed by using a plugin and makes the page viewing experience more seamless.

More complicated functionality can be achieved through the use of a new generation of web extensions. Google recommends in particular:

  • For browser to browser voice calling, video chat and p2p filesharing, Chrome recommend WebRTC (supported by most browsers other than Internet Explorer and Safari which still require a plugin)
  • Adaptive streaming and time-shifting live streams  - allowing JavaScript to generate responsive media streams for playback - can be achieved with Media Source Extensions
  • Digital Rights Management is covered by Encrypted Media Extensions, standardised over different browsers to allow seamless interaction with Content Decryption Modules. This extension type permits anything from simple Clear Key Decryption to high value video
  • Extensions for communication between native apps are also available. Users are required to download APIs which support tasks of escalating complexity - from one-time requests to long-lived connections and cross-extension messages

Google have good reasons for dropping NPAPI, and the improvements offered by HTML5 and related extensions clearly outweigh any benefits with sticking to the old technology. Most developers have already moved on, and those that haven’t will find NPAPIs descendants are more polished and performant than anything that has gone before. We are looking forward to seeing what these next gen tools are capable of.

Developer News - What's IN with the Infragistics Community? (2/9-2/15)


Upcoming Webinar: How to Choose the Right Chart for Your Data

$
0
0

When building out complex data visualizations, it’s easy to get overwhelmed by the virtually endless array of options around how to sort, filter, and display your data. Where do you even start? Check out our upcoming webinar: How to Choose the Right Chart for Your Data.

Infragistics Senior VP of Developer Tools, Jason Beres, will walk you through many of the various chart types found in the iOS, Windows Forms and jQuery controls of Infragistics Ultimate – he’ll even go over some data viz do’s and don’ts. And as an added bonus, every attendee will be entered into a raffle to win a free iPad!

Space is limited, so reserve your spot today. We’ll see you on March 11th!

Exploring the Windows Forms controls in our new Cashflow Dashboard

$
0
0

This month, Infragistics takes you through the creation of a financial cash flow dashboard using our Windows Forms controls, but without looking like a typical clunky Windows Forms application.

[youtube] width="560" height="315" src="http://www.youtube.com/embed/SBPobvWdkQ8" [/youtube]

To start with, Infragistics designers came up with a mockup of what they wanted the application to look like:

After all was said and done, the finished application looks like this:

The biggest challenge implementing this was the chart on top in the ‘total cashflow’ section. The new Infragistics UltraDataChart is a powerful control, but it could not achieve the desired effect here right out of the box. As you can see, the total cashflow chart has two different Y Axes, and the middle section is really nothing but a series of labels. This took some creative coding.

In fact, that top chart is really 3 separate chart controls that are cleverly styled to appear as one.

The first chart is a simple Line Series.


The second is a chart that only displays Axis labels and no data.

And the third chart contains 4 Column Series – two for inflow and outflow and two more for the projected values (which display as circles).

This required the addition of a separate UltraScrollBar control to allow synchronized scrolling of all three charts. And the highlight of the ‘active’ item was achieved using the Paint event of the controls to draw a semi-transparent overlay and a border.

The bottom section of the dashboard displays details of inflow and outflow using either a StackSeries or an AreaSeries, depending on the user’s selection:

And we round things out with an UltraWinGrid to show the actual numbers.

The summary blocks on the left side of the dashboard are UserControls which contain Infragistics UltraLabel controls. They are arranged inside the UltraGridBagLayoutPanel so that they size proportionally along with the form.

When you start off by seeing just how much data we needed to include in this dashboard, it's pretty impressive to see the finished product. 

Inspired to build your own dashboard next? Grab your free trial of Infragistics Ultimate, check out our making of the app video, and get the code for yourself so you can start creating some in-depth visualizations like this one. Happy coding!

Common Business Scenarios with Infragistics UltraDataChart

$
0
0

Infragistics UltraDataChart Control has been engineered to dramatically simplify the way in which you visually present information to your end-users. Optimized for both performance and flexibility, the WinForms DataChart is a highly customizable control library which can be leveraged in a nearly endless number of business scenarios, be it real-time charting or analysis of multi-dimensional data.

The updated Windows Forms Data Chart is fast, fully-featured, and arguably the most modern Windows Forms chart on the market. Smoothly animate data over time using the innovative Motion Framework, create composite charts, and use multiple series, featuring a range of series that include Line, Stacked Line, Stacked Area, Stacked 100-Bar, Column, Waterfall, Candlestick and more.


Using the UltraDataChart

The UltraDataChart offers powerful ways to interact with data, such as zooming, trendlines and chart synchronization. In addition to all the types supported by the XamChart, UltraDataChart supports polar and radial series types. It enables developers to not only visualize the data, but also enable users to interact with it. The UltraDataChart only supports 2D chart types, and chart types which do not require an axis, such as a pie, and funnel will be implemented by separate controls like the Pie Chart, Funnel Chart etc.


How do you use the UltraDataChart

  • Declare the axes (the UltraDataChart supports string (CategoryXAxis, CategoryYAxis, CategoryAngleAxis), numeric (NumericXAxis, NumericYAxis, NumericRadiusAxis, NumericAngleAxis), and date (CategoryDateTimeAxis). In this case we’d like to have dates along the X axis, and numeric values along the Y axis, so we’re using the CategoryDateTimeXAxis and the NumericYAxis.
  • Declare the series, referencing the two axes
  • Declare tooltips


Infragistics Windows Forms UltraDataChart High Performance Scenarios

When you’re dealing with real-time or large volumes of data, the three most critical factors for the user experience of your application are performance, performance and…performance! Customers are often interested in the performance of the UltraDataChart (the fast chart component featuring zooming and panning in Infragistics Windows Forms controls). Rather than just say “well, they’re capable of handling millisecond-based updates without noticeable delay in rendering, and are in use at mission-critical applications handling real-time and high-volume data", let's see the chart in action in a few different high performance scenarios!


UltraDataChart real-time data scenario

This scenario shows the UltraDataChart bound to a real-time data feed. You can start or stop the real-time data feed by clicking the Toggle Live Data button, and can modify the speed of data update and the amount of data displayed in the chart control using the two sliders above. You can see the time it takes to layout the points in the chart in the label above it, just so you can get an idea of how fast the UltraDataChart really is.

UltraDataChart-Scenarios-Pic01[1]

The source code is available below:

 1:using System;
 2:using System.Collections;
 3:using System.Collections.Generic;
 4:using System.Collections.ObjectModel;
 5:using System.Drawing;
 6:using System.Globalization;
 7:using System.Linq;
 8:using System.Windows.Forms;
 9:using Infragistics.Controls.Charts;
 10:using Infragistics.Extension.Models;
 11:using Infragistics.Extension.Services;
 12:using Infragistics.Win.DataVisualization;
 13:using HorizontalAlignment = Infragistics.Portable.Components.UI.HorizontalAlignment;
 14:  
 15:namespace Infragistics.Samples
 16: {
 17:publicpartialclass SampleForm : Form
 18:     {
 19:#region Default constructor
 20:public SampleForm()
 21:         {
 22:             InitializeComponent();
 23:             Load += OnFormLoaded;
 24:             btnReset.Click += btnReset_Click;
 25:         }
 26:#endregion// Default constructor
 27:  
 28:#region Protected Members
 29:protected DataStockService StockService;
 30:protected UltraDataChart PriceChart;
 31:protected UltraDataChart VolumeChart;
 32:#endregion// Protected Members
 33:  
 34:#region Events
 35:  
 36:#region OnFormLoaded
 37:privatevoid OnFormLoaded(object sender, EventArgs e)
 38:         {
 39:             InitializeForm();
 40:  
 41:             StockService = new DataStockService();
 42:             StockService.DataStockReceived += StockService_DataStockReceived;
 43:  
 44:             var data = StockService.DataPoints;
 45:  
 46:             PriceChart = CreatePriceChart(data);
 47:             VolumeChart = CreateVolumeChart(data);
 48:  
 49:             var table = new TableLayoutPanel
 50:             {
 51:                 Dock = DockStyle.Fill,
 52:                 AutoSizeMode = AutoSizeMode.GrowOnly,
 53:                 GrowStyle = TableLayoutPanelGrowStyle.AddRows
 54:             };
 55:             table.Controls.Add(PriceChart, 0, 1);
 56:             table.Controls.Add(VolumeChart, 0, 2);
 57:  
 58:             PanelCenter.ClientArea.Controls.Add(table);
 59:         }
 60:#endregion// OnFormLoaded
 61:  
 62:#region btnReset_Click
 63:void btnReset_Click(object sender, EventArgs e)
 64:         {
 65:             PriceChart.ResetZoom();
 66:             VolumeChart.ResetZoom();
 67:         }
 68:#endregion// btnReset_Click
 69:  
 70:#region StockService_DataStockReceived
 71:void StockService_DataStockReceived(object sender, DataStockReceivedEventArgs e)
 72:         {
 73://var data = StockService.DataPoints;
 74:             var data = new DataStockList();
 75:             data.AddRange(StockService.DataPoints);
 76:  
 77:             UpdatePriceChart(data);
 78:             UpdateVolumeChart(data);
 79:         }
 80:#endregion// StockService_DataStockReceived
 81:  
 82:#region OnAxisXFormatLabel
 83:string OnAxisXFormatLabel(AxisLabelInfo info)
 84:         {
 85:             var item = info.Item as DataStockPoint;
 86:if (item != null) return item.Date.ToString("yyyy/MM/dd");
 87:  
 88:return info.ToString();
 89:         }
 90:#endregion// OnAxisXFormatLabel
 91:  
 92:#region OnAxisYFormatLabel
 93:string OnAxisYFormatLabel(AxisLabelInfo info)
 94:         {
 95:             var axisValue = info.Value;
 96:if (axisValue < 1000)
 97:returnstring.Format("{0:0.#}", axisValue);
 98:if (axisValue < 1000000)
 99:returnstring.Format("{0:#,0,.#} K", axisValue);
 100:if (axisValue < 1000000000)
 101:returnstring.Format("{0:#,0,,.#} M", axisValue);
 102:if (axisValue < 1000000000000)
 103:returnstring.Format("{0:#,0,,,.#} B", axisValue);
 104:  
 105:return axisValue.ToString();
 106:         }
 107:#endregion// OnAxisYFormatLabel
 108:  
 109:#endregion
 110:  
 111:#region Methods
 112:  
 113:#region InitializeForm
 114:publicvoid InitializeForm()
 115:         {
 116:             speedEditor.ValueChanged += speedEditor_ValueChanged;
 117:             btnStartService.Click += btnStartService_Click;
 118:  
 119:// Add the form's caption as the sample name
 120:             ultraFormManager1.FormStyleSettings.Caption = Properties.Resources.SampleTitle;
 121:  
 122:// Add button images on the form
 123:this.LoadImagesFor(SplitterTop, SplitterRight);
 124:  
 125:// Add the sample description
 126:             sampleInfo.SampleDescription = Resources.SamplesBrowser.SamplesBrowser.SampleDescription;
 127:             sampleInfo.SampleCodeCSharp = Properties.Resources.CS_CodeView;
 128:             sampleInfo.SampleCodeVBasic = Properties.Resources.VB_CodeView;
 129:             sampleInfo.SampleTitle = Properties.Resources.CodeViewerTitle;
 130:  
 131:             speedEditor.PropertyName = Properties.Resources.SpeedEditor_Label;
 132:         }
 133:#endregion// InitializeForm
 134:  
 135:#region CreatePriceChart
 136:public UltraDataChart CreatePriceChart(DataStockList data)
 137:         {
 138:             var chart = new UltraDataChart
 139:             {
 140:                 Width = 400,
 141:                 Height = 200,
 142:                 Dock = DockStyle.Fill,
 143:                 BackColor = System.Drawing.Color.White,
 144:                 PlotAreaBackground = new SolidColorBrush { Color = Color.White },
 145:                 Title = data.CompanyName,
 146:                 Subtitle = Properties.Resources.StockPrice,
 147:                 VerticalZoomable = true,
 148:                 HorizontalZoomable = true
 149:             };
 150:  
 151:             var xAxis = new CategoryXAxis
 152:             {
 153:                 Label = "Date",
 154:                 DataSource = data,
 155:                 LabelLocation = AxisLabelsLocation.OutsideBottom,
 156:                 UseClusteringMode = true
 157:             };
 158:             xAxis.FormatLabel += OnAxisXFormatLabel;
 159:  
 160:             var yAxis = new NumericYAxis
 161:             {
 162:                 LabelExtent = 50,
 163:                 LabelHorizontalAlignment = HorizontalAlignment.Right
 164:             };
 165:             yAxis.FormatLabel += OnAxisYFormatLabel;
 166:  
 167:             var yAxis2 = new NumericYAxis
 168:             {
 169:                 LabelExtent = 20,
 170:                 LabelLocation = AxisLabelsLocation.OutsideRight
 171:             };
 172:  
 173:             var series = new AreaSeries
 174:             {
 175:                 DataSource = data,
 176:                 ValueMemberPath = "Open",
 177:                 XAxis = xAxis,
 178:                 YAxis = yAxis,
 179:                 MarkerType = MarkerType.None,
 180:                 IsHighlightingEnabled = true
 181:             };
 182:  
 183:             chart.Axes.Add(xAxis);
 184:             chart.Axes.Add(yAxis);
 185:             chart.Axes.Add(yAxis2);
 186:             chart.Series.Add(series);
 187:return chart;
 188:         }
 189:#endregion// CreatePriceChart
 190:  
 191:#region CreateVolumeChart
 192:public UltraDataChart CreateVolumeChart(DataStockList data)
 193:         {
 194:             var chart = new UltraDataChart
 195:             {
 196:                 BackColor = System.Drawing.Color.White,
 197:                 PlotAreaBackground = new SolidColorBrush { Color = Color.White },
 198:                 Dock = DockStyle.Fill,
 199:                 Width = 400,
 200:                 Height = 200,
 201:                 Padding = new Padding(0, 0, 20, 0),
 202:                 Subtitle = Properties.Resources.StockVolume,
 203:                 VerticalZoomable = true,
 204:                 HorizontalZoomable = true
 205:             };
 206:  
 207:             var xAxis = new CategoryXAxis
 208:             {
 209:                 Label = "Date",
 210:                 DataSource = data,
 211:                 LabelLocation = AxisLabelsLocation.OutsideBottom
 212:             };
 213:             xAxis.FormatLabel += OnAxisXFormatLabel;
 214:  
 215:             var yAxis = new NumericYAxis
 216:             {
 217:                 LabelExtent = 50,
 218:                 LabelHorizontalAlignment = HorizontalAlignment.Right
 219:             };
 220:             yAxis.FormatLabel += OnAxisYFormatLabel;
 221:  
 222:             var yAxis2 = new NumericYAxis
 223:             {
 224:                 LabelExtent = 20,
 225:                 LabelLocation = AxisLabelsLocation.OutsideRight
 226:             };
 227:  
 228:             var series = new ColumnSeries
 229:             {
 230:                 DataSource = data,
 231:                 ValueMemberPath = "Volume",
 232:                 XAxis = xAxis,
 233:                 YAxis = yAxis,
 234:                 IsHighlightingEnabled = true,
 235:                 IsTransitionInEnabled = false
 236:             };
 237:  
 238:             chart.Axes.Add(xAxis);
 239:             chart.Axes.Add(yAxis);
 240:             chart.Axes.Add(yAxis2);
 241:             chart.Series.Add(series);
 242:return chart;
 243:         }
 244:#endregion// CreateVolumeChart
 245:  
 246:#region UpdatePriceChart
 247:privatevoid UpdatePriceChart(IEnumerable data)
 248:         {
 249:             var DataSource = data asobject[] ?? data.Cast<object>().ToArray();
 250:  
 251:             var series = PriceChart.Series.FirstOrDefault();
 252:if (series != null)
 253:             {
 254:                 series.DataSource = DataSource;
 255:                 series.RenderSeries(false);
 256:             }
 257:  
 258:             var xAxis = PriceChart.Axes[0] as CategoryXAxis;
 259:if (xAxis != null)
 260:             {
 261:                 xAxis.DataSource = DataSource;
 262:                 xAxis.RenderAxis();
 263:             }
 264:         }
 265:#endregion// UpdatePriceChart
 266:  
 267:#region UpdateVolumeChart
 268:privatevoid UpdateVolumeChart(IEnumerable data)
 269:         {
 270:             var DataSource = data asobject[] ?? data.Cast<object>().ToArray();
 271:  
 272:             var series = VolumeChart.Series.FirstOrDefault();
 273:if (series != null)
 274:             {
 275:                 series.DataSource = DataSource;
 276:                 series.RenderSeries(false);
 277:             }
 278:  
 279:             var xAxis = VolumeChart.Axes[0] as CategoryXAxis;
 280:if (xAxis != null)
 281:             {
 282:                 xAxis.DataSource = DataSource;
 283:                 xAxis.RenderAxis();
 284:             }
 285:         }
 286:#endregion// UpdateVolumeChart
 287:  
 288:#region speedEditor_ValueChanged
 289:void speedEditor_ValueChanged(object sender, EventArgs e)
 290:         {
 291:             var value = speedEditor.PropertyValue;
 292:             StockService.UpdateInterval = TimeSpan.FromMilliseconds(value);
 293:         }
 294:#endregion// speedEditor_ValueChanged
 295:  
 296:#region btnStartService_Click
 297:void btnStartService_Click(object sender, EventArgs e)
 298:         {
 299:if (StockService.IsEnabled)
 300:                 StockService.Stop();
 301:else
 302:                 StockService.Start();
 303:         }
 304:#endregion// btnStartService_Click
 305:  
 306:#endregion// Methods
 307:     }
 308:  
 309:#region StockInformation class
 310:publicclass StockInformation
 311:     {
 312:publicstring CompanyName;
 313:publicstring StockSymbol;
 314:     } 
 315:#endregion// StockInformation class
 316: }


UltraDataChart high-volume data scenario

The UltraDataChart high-volume data scenario allows the user to set the number of points to be bound to the chart control. You can use big amount of data - this chart can fit more than a year’s worth of data readings taken each second - but feel free to increase that according to the requirements of your scenario. You can try the zooming and panning using the mouse and zoombars to see the level of performance this component delivers when bound to such a high-volume dataset.

When changing only one or two points in data that is bound to the Series object’s DataSource property, you should avoid sending the Reset event from the INotifyCollectionChanged interface. In the prior version of the UltraDataChart control, sending one refresh event instead of several smaller events was preferable.

This code snippet shows how to notify about changes in custom collection using the Add event action instead of the Reset event action when a new data point is added to the collection.

 1:using System.Collections;
 2:using System.Collections.Generic;
 3:using System.Collections.Specialized;
 4:using NotifyEventArgs = System.Collections.Specialized.NotifyCollectionChangedEventArgs;
 5:using NotifyAction = System.Collections.Specialized.NotifyCollectionChangedAction;
 6:  
 7:publicclass DataCollection : INotifyCollectionChanged, IEnumerable
 8: {
 9:protected List Data = new List();
 10:publicevent NotifyCollectionChangedEventHandler CollectionChanged;
 11:protectedvoid OnCollectionChanged(NotifyEventArgs e)
 12:         {
 13:if (CollectionChanged != null)
 14:             {
 15:                 CollectionChanged(this, e);
 16:             }
 17:         } 
 18:public IEnumerator GetEnumerator()
 19:         {
 20:returnthis.Data.GetEnumerator();
 21:         } 
 22:publicvoid Add(DataPoint dataPoint)
 23:         {
 24:this.Data.Add(dataPoint);
 25:             NotifyEventArgs e = new NotifyEventArgs(NotifyAction.Add, dataPoint);
 26:// use the Add event action instead of the Reset event action 
 27:// when adding only one or two points to the collection
 28://NotifyEventArgs e = new NotifyEventArgs(NotifyAction.Reset);
 29:this.OnCollectionChanged(e);
 30:         } 
 31: } 


Motion Framework

You can animate data over time using the innovative Motion Framework, create composite charts, and use multiple series with our new Windows Forms Data Chart control. This approach is used mainly when you have multidimensional data and one of the dimensions is time. You can demonstrate how values are changed during the time using awesome animations.


UltraDataChart-Scenarios-Pic02[1]


This sample demonstrates how to use the Motion Framework™ with the DataChart control to build highly engaging visualizations and provide smooth playback of changes in data over time.

 1:using Infragistics.Extension;
 2:  
 3:namespace Infragistics.Samples
 4: {
 5:partialclass MotionFramework
 6:     {
 7:/// 
 8:/// Required designer variable.
 9:/// 
 10:private System.ComponentModel.IContainer components = null;
 11:  
 12:/// 
 13:/// Clean up any resources being used.
 14:/// 
 15:///true if managed resources should be disposed; otherwise, false.
 16:protectedoverridevoid Dispose(bool disposing)
 17:         {
 18:if (disposing && (components != null))
 19:             {
 20:                 components.Dispose();
 21:             }
 22:base.Dispose(disposing);
 23:         }
 24:  
 25:#region Windows Form Designer generated code
 26:  
 27:/// 
 28:/// Required method for Designer support - do not modify
 29:/// the contents of this method with the code editor.
 30:/// 
 31:privatevoid InitializeComponent()
 32:         {
 33:this.components = new System.ComponentModel.Container();
 34:             System.ComponentModel.ComponentResourceManager resources = new System.ComponentModel.ComponentResourceManager(typeof(MotionFramework));
 35:this.ultraFormManager1 = new Infragistics.Win.UltraWinForm.UltraFormManager(this.components);
 36:this._CardView_UltraFormManager_Dock_Area_Left = new Infragistics.Win.UltraWinForm.UltraFormDockArea();
 37:this._CardView_UltraFormManager_Dock_Area_Right = new Infragistics.Win.UltraWinForm.UltraFormDockArea();
 38:this._CardView_UltraFormManager_Dock_Area_Top = new Infragistics.Win.UltraWinForm.UltraFormDockArea();
 39:this._CardView_UltraFormManager_Dock_Area_Bottom = new Infragistics.Win.UltraWinForm.UltraFormDockArea();
 40:this.MainPanel = new Infragistics.Win.Misc.UltraPanel();
 41:this.PanelCenter = new Infragistics.Win.Misc.UltraPanel();
 42:this.SplitterRight = new Infragistics.Win.Misc.UltraSplitter();
 43:this.PanelRight = new Infragistics.Win.Misc.UltraPanel();
 44:this.btnToggleAnimation = new Infragistics.Win.Misc.UltraButton();
 45:this.SplitterTop = new Infragistics.Win.Misc.UltraSplitter();
 46:this.PanelTop = new Infragistics.Win.Misc.UltraPanel();
 47:this.sampleInfo = new Infragistics.Extension.SampleInfoControl();
 48:             ((System.ComponentModel.ISupportInitialize)(this.ultraFormManager1)).BeginInit();
 49:this.MainPanel.ClientArea.SuspendLayout();
 50:this.MainPanel.SuspendLayout();
 51:this.PanelCenter.SuspendLayout();
 52:this.PanelRight.ClientArea.SuspendLayout();
 53:this.PanelRight.SuspendLayout();
 54:this.PanelTop.ClientArea.SuspendLayout();
 55:this.PanelTop.SuspendLayout();
 56:this.SuspendLayout();
 57:// 
 58:// ultraFormManager1
 59:// 
 60:this.ultraFormManager1.Form = this;
 61:this.ultraFormManager1.FormStyleSettings.FormDisplayStyle = Infragistics.Win.UltraWinToolbars.FormDisplayStyle.StandardWithRibbon;
 62:this.ultraFormManager1.UseOsThemes = Infragistics.Win.DefaultableBoolean.False;
 63:// 
 64:// _CardView_UltraFormManager_Dock_Area_Left
 65:// 
 66:this._CardView_UltraFormManager_Dock_Area_Left.AccessibleRole = System.Windows.Forms.AccessibleRole.Grouping;
 67:this._CardView_UltraFormManager_Dock_Area_Left.BackColor = System.Drawing.SystemColors.Control;
 68:this._CardView_UltraFormManager_Dock_Area_Left.DockedPosition = Infragistics.Win.UltraWinForm.DockedPosition.Left;
 69:this._CardView_UltraFormManager_Dock_Area_Left.ForeColor = System.Drawing.SystemColors.ControlText;
 70:this._CardView_UltraFormManager_Dock_Area_Left.FormManager = this.ultraFormManager1;
 71:this._CardView_UltraFormManager_Dock_Area_Left.InitialResizeAreaExtent = 8;
 72:             resources.ApplyResources(this._CardView_UltraFormManager_Dock_Area_Left, "_CardView_UltraFormManager_Dock_Area_Left");
 73:this._CardView_UltraFormManager_Dock_Area_Left.Name = "_CardView_UltraFormManager_Dock_Area_Left";
 74:// 
 75:// _CardView_UltraFormManager_Dock_Area_Right
 76:// 
 77:this._CardView_UltraFormManager_Dock_Area_Right.AccessibleRole = System.Windows.Forms.AccessibleRole.Grouping;
 78:this._CardView_UltraFormManager_Dock_Area_Right.BackColor = System.Drawing.SystemColors.Control;
 79:this._CardView_UltraFormManager_Dock_Area_Right.DockedPosition = Infragistics.Win.UltraWinForm.DockedPosition.Right;
 80:this._CardView_UltraFormManager_Dock_Area_Right.ForeColor = System.Drawing.SystemColors.ControlText;
 81:this._CardView_UltraFormManager_Dock_Area_Right.FormManager = this.ultraFormManager1;
 82:this._CardView_UltraFormManager_Dock_Area_Right.InitialResizeAreaExtent = 8;
 83:             resources.ApplyResources(this._CardView_UltraFormManager_Dock_Area_Right, "_CardView_UltraFormManager_Dock_Area_Right");
 84:this._CardView_UltraFormManager_Dock_Area_Right.Name = "_CardView_UltraFormManager_Dock_Area_Right";
 85:// 
 86:// _CardView_UltraFormManager_Dock_Area_Top
 87:// 
 88:this._CardView_UltraFormManager_Dock_Area_Top.AccessibleRole = System.Windows.Forms.AccessibleRole.Grouping;
 89:this._CardView_UltraFormManager_Dock_Area_Top.BackColor = System.Drawing.SystemColors.Control;
 90:this._CardView_UltraFormManager_Dock_Area_Top.DockedPosition = Infragistics.Win.UltraWinForm.DockedPosition.Top;
 91:this._CardView_UltraFormManager_Dock_Area_Top.ForeColor = System.Drawing.SystemColors.ControlText;
 92:this._CardView_UltraFormManager_Dock_Area_Top.FormManager = this.ultraFormManager1;
 93:             resources.ApplyResources(this._CardView_UltraFormManager_Dock_Area_Top, "_CardView_UltraFormManager_Dock_Area_Top");
 94:this._CardView_UltraFormManager_Dock_Area_Top.Name = "_CardView_UltraFormManager_Dock_Area_Top";
 95:// 
 96:// _CardView_UltraFormManager_Dock_Area_Bottom
 97:// 
 98:this._CardView_UltraFormManager_Dock_Area_Bottom.AccessibleRole = System.Windows.Forms.AccessibleRole.Grouping;
 99:this._CardView_UltraFormManager_Dock_Area_Bottom.BackColor = System.Drawing.SystemColors.Control;
 100:this._CardView_UltraFormManager_Dock_Area_Bottom.DockedPosition = Infragistics.Win.UltraWinForm.DockedPosition.Bottom;
 101:this._CardView_UltraFormManager_Dock_Area_Bottom.ForeColor = System.Drawing.SystemColors.ControlText;
 102:this._CardView_UltraFormManager_Dock_Area_Bottom.FormManager = this.ultraFormManager1;
 103:this._CardView_UltraFormManager_Dock_Area_Bottom.InitialResizeAreaExtent = 8;
 104:             resources.ApplyResources(this._CardView_UltraFormManager_Dock_Area_Bottom, "_CardView_UltraFormManager_Dock_Area_Bottom");
 105:this._CardView_UltraFormManager_Dock_Area_Bottom.Name = "_CardView_UltraFormManager_Dock_Area_Bottom";
 106:// 
 107:// MainPanel
 108:// 
 109:// 
 110:// MainPanel.ClientArea
 111:// 
 112:this.MainPanel.ClientArea.Controls.Add(this.PanelCenter);
 113:this.MainPanel.ClientArea.Controls.Add(this.SplitterRight);
 114:this.MainPanel.ClientArea.Controls.Add(this.PanelRight);
 115:this.MainPanel.ClientArea.Controls.Add(this.SplitterTop);
 116:this.MainPanel.ClientArea.Controls.Add(this.PanelTop);
 117:             resources.ApplyResources(this.MainPanel, "MainPanel");
 118:this.MainPanel.Name = "MainPanel";
 119:// 
 120:// PanelCenter
 121:// 
 122:this.PanelCenter.BorderStyle = Infragistics.Win.UIElementBorderStyle.None;
 123:             resources.ApplyResources(this.PanelCenter, "PanelCenter");
 124:this.PanelCenter.Name = "PanelCenter";
 125:// 
 126:// SplitterRight
 127:// 
 128:this.SplitterRight.BackColor = System.Drawing.SystemColors.Control;
 129:             resources.ApplyResources(this.SplitterRight, "SplitterRight");
 130:this.SplitterRight.Name = "SplitterRight";
 131:this.SplitterRight.RestoreExtent = 250;
 132:// 
 133:// PanelRight
 134:// 
 135:this.PanelRight.AutoScroll = true;
 136:this.PanelRight.BorderStyle = Infragistics.Win.UIElementBorderStyle.None;
 137:// 
 138:// PanelRight.ClientArea
 139:// 
 140:this.PanelRight.ClientArea.Controls.Add(this.btnToggleAnimation);
 141:             resources.ApplyResources(this.PanelRight, "PanelRight");
 142:this.PanelRight.Name = "PanelRight";
 143:// 
 144:// btnToggleAnimation
 145:// 
 146:             resources.ApplyResources(this.btnToggleAnimation, "btnToggleAnimation");
 147:this.btnToggleAnimation.Name = "btnToggleAnimation";
 148:this.btnToggleAnimation.ShowFocusRect = false;
 149:// 
 150:// SplitterTop
 151:// 
 152:this.SplitterTop.BackColor = System.Drawing.SystemColors.Control;
 153:             resources.ApplyResources(this.SplitterTop, "SplitterTop");
 154:this.SplitterTop.Name = "SplitterTop";
 155:this.SplitterTop.RestoreExtent = 100;
 156:// 
 157:// PanelTop
 158:// 
 159:this.PanelTop.BorderStyle = Infragistics.Win.UIElementBorderStyle.None;
 160:// 
 161:// PanelTop.ClientArea
 162:// 
 163:this.PanelTop.ClientArea.Controls.Add(this.sampleInfo);
 164:             resources.ApplyResources(this.PanelTop, "PanelTop");
 165:this.PanelTop.Name = "PanelTop";
 166:this.PanelTop.Tag = "Top";
 167:// 
 168:// sampleInfo
 169:// 
 170:             resources.ApplyResources(this.sampleInfo, "sampleInfo");
 171:this.sampleInfo.BackColor = System.Drawing.Color.Transparent;
 172:this.sampleInfo.Name = "sampleInfo";
 173:this.sampleInfo.SampleCodeCSharp = resources.GetString("sampleInfo.SampleCodeCSharp");
 174:this.sampleInfo.SampleCodeVBasic = null;
 175:this.sampleInfo.SampleDescription = null;
 176:this.sampleInfo.SampleTitle = "Code Viewer";
 177:// 
 178:// MotionFramework
 179:// 
 180:             resources.ApplyResources(this, "$this");
 181:this.AutoScaleMode = System.Windows.Forms.AutoScaleMode.Dpi;
 182:this.Controls.Add(this.MainPanel);
 183:this.Controls.Add(this._CardView_UltraFormManager_Dock_Area_Left);
 184:this.Controls.Add(this._CardView_UltraFormManager_Dock_Area_Right);
 185:this.Controls.Add(this._CardView_UltraFormManager_Dock_Area_Top);
 186:this.Controls.Add(this._CardView_UltraFormManager_Dock_Area_Bottom);
 187:this.Name = "MotionFramework";
 188:             ((System.ComponentModel.ISupportInitialize)(this.ultraFormManager1)).EndInit();
 189:this.MainPanel.ClientArea.ResumeLayout(false);
 190:this.MainPanel.ResumeLayout(false);
 191:this.PanelCenter.ResumeLayout(false);
 192:this.PanelRight.ClientArea.ResumeLayout(false);
 193:this.PanelRight.ResumeLayout(false);
 194:this.PanelTop.ClientArea.ResumeLayout(false);
 195:this.PanelTop.ClientArea.PerformLayout();
 196:this.PanelTop.ResumeLayout(false);
 197:this.ResumeLayout(false);
 198:  
 199:         }
 200:  
 201:#endregion
 202:  
 203:private Infragistics.Win.UltraWinForm.UltraFormManager ultraFormManager1;
 204:private Infragistics.Win.UltraWinForm.UltraFormDockArea _CardView_UltraFormManager_Dock_Area_Left;
 205:private Infragistics.Win.UltraWinForm.UltraFormDockArea _CardView_UltraFormManager_Dock_Area_Right;
 206:private Infragistics.Win.UltraWinForm.UltraFormDockArea _CardView_UltraFormManager_Dock_Area_Top;
 207:private Infragistics.Win.UltraWinForm.UltraFormDockArea _CardView_UltraFormManager_Dock_Area_Bottom;
 208:private Infragistics.Win.Misc.UltraPanel MainPanel;
 209:private Infragistics.Win.Misc.UltraSplitter SplitterTop;
 210:private Infragistics.Win.Misc.UltraPanel PanelTop;
 211:private Infragistics.Win.Misc.UltraSplitter SplitterRight;
 212:private Infragistics.Win.Misc.UltraPanel PanelRight;
 213:private Infragistics.Win.Misc.UltraPanel PanelCenter;
 214:private SampleInfoControl sampleInfo;
 215:private Win.Misc.UltraButton btnToggleAnimation;
 216:     }
 217: }


Summary

The UltraDataChart is a powerful charting control, enabling users to browse and interact with data in a much richer way using zooming, inter-chart synchronization and tooltips. With a variety of series types and built-in trendlines, it’s fully capable of handing your charting scenarios. Talk to users of your applications and ask them where they can benefit from browsing their data in a visual way.

The Infragistics Windows Forms Data Visualization controls also offer a wide range of options to create almost any dashboard that you need. In this post we discussed how to use Infragistics UltraDataChart , but you can see samples of how to use any of other data visualization components on the Infragistics Windows Forms Samples Browser. There, you'll find detailed information about the control and its features and how to configure its separate parts in the API documentation as well as the online help documentation.

To play around with the Infragistics Windows Forms dashboards on your own, be sure to get Infragistics Ultimate and see the chart in action in our latest sample application by clicking the banner below!

Developer News - What's IN with the Infragistics Community? (2/16-2/22)

Open source .NET: A progress report

$
0
0

Microsoft surprised both their friends and rivals when they announced they would open source .NET Core in November 2014. Although now widely available on GitHub, it’s worth noting that not everything is open source just yet and is still work in progress.

However, before we get ahead of ourselves, we should ask the question, just what is .NET Core? To be clear, it is not the entire .NET Framework. Microsoft decided to rebuild their .NET Framework gradually as an open source project and has named that .NET Core. The probable reason is that the code for their .NET Framework is not suitable to release as open source at this stage.

.NET Core is a modular development stack that is the foundation of all future .NET platforms. However, it’s not a replacement for the .NET Framework; it offers only a subset of functionality currently available in the .NET Framework. Developers should therefore bear in mind that when building large enterprise applications for example, the .NET Framework is still the way to go.

A follow up blog post here explains in detail .NET Core and its relationship with the .NET Framework. In Visual Studio 2015, .NET Core will be a pure subset of the .NET Framework. Anything available in .NET Core is therefore also available in the .NET Framework. However, as .NET Core is open source, it will most likely evolve quicker than the .NET Framework. It might happen that .NET Core will have features that are not available in the .NET Framework.

How to contribute to .NET Core?

You may well be thinking about contributing to .NET Core, indeed Microsoft is actively encouraging users to do so; one reason for making .NET Core open source was to benefit from the contribution of the community. However, just as with any major open source project, not all contributions can be accepted. There is still a road map and not every contribution will fit in this road map.

This post in the Visual Studio magazine outlines five excellent tips for those planning on contributing to .NET Core. It includes important links to external websites, for example to Microsoft’s GitHub repository and the .NET contribution guidelines.

The first and most important rule for contributions is: "unless it is a trivial change, make sure that there is a corresponding issue for your change first. If there is none, create one”. An issue is very important, so the reason behind a change can be recorded and, more importantly, it gives an insight as to how popular an issue is - it doesn’t make sense to introduce a breaking change to fix an issue nobody cares about.

The .NET Foundation - some background

As there are many open source .NET projects on the web, the .NET Foundation organization was created. It provides a developer forum, a test bed, and a practice ground for the very rapidly growing community that contributes to open source .NET projects like .NET Core. Another great benefit is that it allows for direct access to .NET project teams at Microsoft and across the community.

Overall the idea of the .NET Foundation is to streamline the contribution to open source .NET projects and to improve the quality of the processes and developed products. Read this “Get involved” page for more information or jump straight to the forums.

Roslyn: the next compiler

As part of the introduction of open source .NET Core, a new compiler was presented: The Roslyn compiler, which is also available on GitHub. The idea of making the compiler open source is to allow contributions from non-Windows compilers. Creating and running .NET projects always previously required a Windows based operating system. With the compiler becoming open source, this is no longer a limitation. It is now even possible to create a .NET application in Linux, written in vi, and compiled from the Linux terminal!

Another great benefit is the option for developers to create custom components for the compiler. It’s easier to investigate the compiler and create custom components when it’s open source. Take a look at some of the samples and walkthroughs.

What’s next?

Microsoft has clearly changed their strategy and one of the results of this shift is the open sourcing of .NET Core and the Roslyn compiler. This is quite different from a couple of years ago, where everything was “Microsoft only” and closed source. For developers this is particularly interesting, as it’s now possible to contribute to the very popular .NET Core.

And, what’s next? Will Microsoft release more (or even all) of their code as open source project? Will Windows be made open source? Many voices have been saying for some time that Internet Explorer should be made open source and it’s interesting to see if there will be an open source element to the new Spartan browser too. We wait and see.

Developer Humor: Salary Concerns

$
0
0

This series needs no introduction... one of my favorite new comics for 2015, and definitely worth at least a hump-day smirk: Salary Concerns!

Salary Concerns by Infragistics WinForms Controls

Share With The Code Below!

<a href="http://www.infragistics.com/products/windows-forms"><img src="http://www.infragistics.com/community/cfs-filesystemfile.ashx/__key/CommunityServer.Blogs.Components.WeblogFiles/d-coding/8664.Tech-toon-_2D00_-2015-_2D00_-med-res-01.jpg" height="825" width="636" /> </a><br /><br /><br />Conversion Confusion by Infragistics <a href="http://www.infragistics.com/products/windows-forms">WinForms Controls</a>

Conversion Confusion by Infragistics WinForms Controls

Prototyping the Cashflow Dashboard

$
0
0

[youtube] width="560" height="315" src="http://www.youtube.com/embed/V5aYaT6Z6tk" [/youtube]

Today we’re going to take a look at how we used Indigo Studio to create a prototype that helped explain some of the interaction designs found in our newest cashflow dashboard.

First, we proposed putting the most important corporate cash flow measures in summary on the left panel. Then, at the top of the main area, we showed two charts for displaying monthly inflow and outflow as well as ending cash value.

We suggested that the designers use a data chart of module series to not only display monthly cash flows, but also allow users to select a particular month right from the chart. There are a few interaction features that the prototype communicates here, so let’s run the prototype and see them now.

Clicking the left or right arrow on the main chart will scroll the chart to a different time range. Notice that the cash flow of data does not change while scrolling, but as expected, the data will be changed if a different month is clicked. I just clicked on the inflow and outflow columns of April 2013 and it is now the selected month for the data being presented.

The dashboard presents more detailed cash flow information in the inflow area and the outflow area. The Indigo prototype shows design intent for chart type selection. Currently, it is showing a stacked bar chart to provide a quick view of inflow from different categories; the current selected month, last month, and the same month from the prior year.

When we click the overall button, the chart changes to an area chart that displays the overall inflow along the time range. The prototype attempts to show that that chart type selection for the inflow and outflow is independent. It helps you visually determine if the design makes sense and can clearly communicate your information to viewers.

Overall, Indigo Studio helped us save time in the design and development process, by giving us the tools to mock up a dashboard design efficiently. By creating this prototype, we also ensured clear communication between the client and the designers in terms of what interactions were needed and what the dashboard was created for.

So now that you’ve seen how we built the prototype, be sure to check out the sample for yourself – and don’t forget to grab your free trial of Infragistics Ultimate to get everything you can from the code. We hope you enjoy!


7 Do's and Don'ts of DataViz

$
0
0

As sites like viz.wtf illustrate, there are many ways to create confusing and misleading data visualizations. There are also many common design-choice options that might be considered sub-optimal. This post outlines 7 common “mistakes”, with alternative solutions that avoid them. It is a personal selection and is certainly not definitive. The data used is all fictitious and the chart labels are somewhat arbitrary, acting primarily as illustrative placeholders.

Don’t use a chart when a sentence will do

Probably the most fundamental question to ask yourself when designing charts: “Is a chart even warranted?”. The great advantage of data visualization is in seeing patterns that aren’t obvious when looking at printed numbers. But how likely is it that you’ll miss a key pattern when your data consists of only a couple of values (left)? A sentence (right) is much quicker to create, takes up less space and uses less ink than a chart. There’s no requirement to think of informative titles or axis labels and no chance that the data will end up well-separated from the context in which it is discussed.


Even if you have a larger number of data points it is still not necessarily the case that a chart is your best option. If your goal is to display values precisely in an easy-lookup format then the structure a table provides is likely the optimal solution.

Don’t go overboard with the vibrant colors

It’s very easy to make a chart pop-out from the page by using large blocks of intense color. Eduard Imhof described why this is a problem for maps in “Cartographic Relief Presentation”:

“Pure, bright or very strong colors have loud, unbearable effects when they stand unrelieved over large areas adjacent to each other, but extraordinary effects can be achieved when they are used sparingly on or between dull background tones.”

The quote applies across other areas of data visualization too. One of the worst offenders is the multicolored bar chart (left) when the colors provide no additional information. We have a glaring array of reds, greens and blues, an apparent encoding of a non-existent variable and no easy way of highlighting something we want to bring particular attention to. If you use modest colors for the bulk of the data and especially the supporting structure of the chart (axes, gridlines etc) then the strongest, most vibrant color(s) can be used to emphasize something particularly important (right).


Things are somewhat different when the data encoding leads to small patches of color, for example points on a scatterplot. In such cases we are less sensitive to the color differences between the small patches. Using higher saturation colors will help to alleviate this problem.

Don’t chop off the bottom of your bar charts

This is another way of saying “always start the bars in your bar charts at 0″.

The beauty of a well-designed bar chart is that, as well as making judgments based on position along a scale, we can directly compare the lengths of any two bars to judge relative magnitude. This relies on the lengths being proportional to the magnitudes of the values encoded and fails completely when they’re not (top left). It’s not just that removing this proportionality removes this feature, but also that the user of the chart is likely to expect that proportionality to exist. This leads to misjudgments of the data and that is worse than no data at all.

This distortion is often used deliberately to mislead and, as a result, even an innocent slip may lead to questions about intent and integrity. There is almost always a better alternative for the honest designer, even when the data concerned show only small variation around some comparatively large number (top right). Line charts are an obvious alternative for continuous data, while dot plots can be useful for discrete data (bottom left). A different approach is to transform the data, for example, by subtracting a “target” value from each data point or inverting the measure plotted (bottom right). (Obviously one needs to be careful that the salient message remains in tact here.)


Rules in data visualization are there to be broken. Make sure you have a very good reason for doing so here.

Don’t use two lines when one will do

This problem is more nuanced than the last and highly dependent on what it is you want to show.

Suppose you have two time-series data sets you want to compare. They have the same units and are roughly similar in magnitude. One option is to plot both lines on the same chart (left). We can see which is higher or lower at any given point in time, observe gradients and see anomalous points. There is absolutely nothing wrong with this and in many cases it is an ideal solution.

However, if what you really want to show is the magnitude (and sign) of the difference between the two time series then your best option is to plot that difference directly (right). The line then encodes the magnitude of this difference, with no requirement for the user to estimate the difference at each point in time.


Cleveland and McGill found a more fundamental difficulty with visually estimating the distance between two lines: “[t]he problem is that the brain wants to judge minimum distance between the curves in different regions, and not vertical distance”. Not only is comparing two lines a slower and more complex task, you’re more likely to get it wrong.

Don’t use a stacked area chart when you want to show individual components accurately

The difficulties we have interpreting differences from pairs of lines extends to stacked area charts. Both the bottom area and the total combined areas of stacked area charts are easy to understand because the horizontal axis provides a distinct, steady baseline. By contrast, the baseline for all the other area components must be constructed mentally, subtracting the shape of the underlying layers from the one of interest. I find this particularly difficult if the overall trend of the underlying layers is opposite to the layer of interest. For example, if the underlying layers trend strongly downwards, the shape of the layer of interest can resemble a (fat) downward sloping line (the Type III area, left). Even though the layer of interest may be getting fatter, the overall impression is of something decreasing when it is actually going up.

If you want your users to get a good sense of the data for the individual components you’re better off using distinct lines, either on a single pair of axes (right) or as small multiples. In the example below we can see magnitudes, gradients, line crossings and the relative sizes of fluctuations more clearly when the categories are plotted as separate lines.


Stacked area charts do have one very good application, namely when you’re interested in showing an ordered sum of components that changes (usually with time). One example of this would be illustrating how the total cost of a pint of milk changes due to fluctuations in farming, processing and retailing costs.

Don’t forget about your users with color vision deficiencies

Color vision deficiency (CVD) is the formal name for what is frequently described as color blindness. The most common problem associated with CVD is difficulty distinguishing reds from greens and is of genetic origin. It’s more prevalent in men (about 1 in 12 suffer) than women (about 1 in 200 suffer).

In western cultures green has come to be associated with “good” things or “go” and red with “bad” or “stop”. As a result of this it can be tempting to use these two colors to distinguish positive and negative outcomes (top left). However, because of CVD, some of your audience is likely to struggle to distinguish these two encodings.

If you only have two categories to encode then a simple solution is to swap green for blue (top right). If you have many categories (bottom left) then you’ll probably have to find a different solution. For example, if you’re plotting points you can change the shape of the points alongside the color (bottom right). This can be seen as redundant (but not harmful) encoding for the majority of your audience but likely essential for those with CVD.


It’s important to note that red-green CVD is more complex than just an inability to distinguish red from green. Color perception is altered in a broader sense, beyond that of those two specific named colors. For non-sufferers it’s thus extremely helpful that there are options for simulating the effects of CVD. Photoshop offers protanopia and deuteranopia (both forms of red-green CVD) filters, the Vischeck website also allows for red-green and blue-yellow CVD simulation of supplied images, and the Color Oracle application will momentarily simulate both red-green and blue-yellow deficiencies for the entire contents of your monitor.

Don’t obscure the data

Background gradients (left) or images can make your data visualization look more interesting and stand out from the page but are unlikely to help your reader draw any more insight from it. They are more likely to be a distraction and effects like simultaneous contrast (which gives rise to some notableopticalillusions) may lead to misperception. In general, keep to a neutral, single-color, background.

Want to learn more? Be sure to register for our upcoming webinar: How to Choose the Right Chart for Your Data, on March 11th. Click the banner below for more info!

How to Code a Multi Series Chart in Windows Forms

$
0
0

[youtube] width="560" height="315" src="http://www.youtube.com/embed/jmAxer96TKM" [/youtube]

In this video we're going to take a look at adding multiple series to a single chart. Essentially, you'll have a chart view, and there'll be overlap series on that chart. You can look at multiple data points in a single chart. This is a very common business scenario. This is a continuation of the video that we just completed, which shows you how to create a chart using the designer.

What we have here is our energy production data, which we're going to reuse. We're going to create an instance of the energy production data sample, and then we're going to use data points within the energy production type. Basically, the country and then the different types of energy that are produced by country.

First, let's go ahead and add a data chart. I'm going to go ahead and dock it full. Now in this sample, the whole thing is going to be done in code behind. We are not going to use the designer for anything, which I think will help everyone learn and understand the API of the chart.

The first thing we're going to do is clear the chart of any axes and series, which is going to be important. Let's say this dot ultradatachart1 dot  series dot clear, and the same with the axes, ultradatachart1 dot axes dot clear. The other thing we're going to do is Using Infragistics dot win dot data visualization is going to be important, because we're going to be referencing these types of the chart in our code behind.

We also want to set up some interaction properties, which will be important as the users actually use the chart. Let's go ahead and set the horizontal and vertical zoomable properties to true. This allows you to do panning and zooming with the mouse or the keyboard. We'll set that to true, and then ultra data chart one dot vertical Zoomable equals true as well, and we'll save that.

The next thing we want to do is create an instance of our data so we have data. We also want to create our numerical Y axes and our category X axes. Remember the numeric Y will be on the left-hand side of the chart, and that's going to be the numeric data that we want to display. On the horizontal category, X axes, we're going to want to show the country.

The first thing we'll do is create an instance of our data, which we'll be reusing throughout. We're going to create a new energy production data sample. Then let's go ahead and create our Y axes. The Y axes is going to be a new numeric Y axes, which we can find here. Of course, remember all of this can be done through the designer as well, but doing it through code behind does teach us a little bit about the chart's object model, and should help you build out samples much easier in the future with the chart.

So there we have our Y and our X axes, which we'll end up reusing. The first thing I want to do is set the data source of the X axes to our data. Then on the label for this I want to set it to the country field, so we'll be able to display each of the countries on the horizontal label for the chart. Let's go ahead and set the label property equal to country like so. Actually, I did not say data source here. So lets do that now..

Now let's go ahead and add the X axes and the Y axes to the chart. Remember these are collections on the chart, so we can just add to the collection. We'll say thisdot ultra data chart one dot axes dot add  and we will add our X axes like so. We'll do the same with the Y axes, so this dot ultra data chart one dot axes dot add This will be Y. It comes right up in the auto complete, so we're good there.

The next thing we want to do is add the series. Now keep in mind, the series are what is going to display, the area chart on the actual chart itself. In this case, we're going to do three series. The first one is going to be coal data, which in the video we did previously with the designer, we actually did the same thing. We did coal data, but we did it using the designer versus doing it in code.

Let's just go ahead and set up some basic properties here. Let's set up the data source equal the data so we have a new series. Now in order to tell which data to show up in the series, we have to use the value member path. Let's set the series dot value member path equal to coal in this case. If we go look at our data, you can see coal is one of the fields that we have here for the types of energy by country and by region for this particular example.

Let's give this a title so we know which one it is, and we're going to say coal. Now we're going to set the X axes and the y axes, of course. Let's go ahead and say series dot X axes here. It's going to be the X axes that we already set up. We just reuse it, and series dot Y axes is the same thing. We just reuse that.

If I ran it now nothing would show up. We need to add this to the chart. We say series dot add, and we have series like so. That's it. Let's go ahead and run this. You can see here we've got our form. I set the interaction, so I can zoom in and out with my mouse. Horizontal and vertical zoomable is true. My numeric Y axes is showing the numeric data on the left, and then my countries are on the bottom.

So let's go ahead and add a few more pieces of data. Same thing. Let's just go ahead and add oil data. Now I'm going to do this in the most manual way possible just so you get a feeling of how to interact with the chart. We're just going to add a new area series like so, and you get the idea. I call this guy series two. Essentially, if I go up here, and I copy everything and I paste it, this is as basic as it gets.

I'm saying create a new series for its title. Let's use “oil”.  What am I adding to the chart? Well I'm not adding series. I'm adding series two. Then if we do the same thing for “hydro” data, in this case I will just copy the whole thing, paste it in. Now let's change this over to series three. Series three, we're going to have to change the title, the value member path. We're going to add series three to the chart, and this guy will be “hydro”. That's it.

Let's go ahead and run it. You can see now I have multiple series on the chart all lined up with my numeric data. If I zoom in, I can glean more information. I can zoom out with my mouse or with my keyboard. It really doesn't matter.

There you have it. That's as easy as it is to create a multi-series chart all in code behind with the Infragistics Windows Forms Charting Control.

Algorithms: The Third Co-Evolutionary Force

$
0
0

      In this world the only things that create and control themselves come from nature; from the mountains to the trees to animals to human beings. A new concept of a third “co-evolutionary force” is discussed when Kevin Slavin takes a new spin on algorithms in his TEDTalk called How Algorithms Shape Our World. Slavin begins by briefly coining algorithms as “the math that computers use to decide stuff”; however, irony lives within this description for as the talk continues, we find that algorithms are much, much more than that. Slavin refers to math as “not something we extract and derive from the world, but as something that shapes us.” We can see the math, specifically algorithms, shaping our actions and decisions in the examples given from Wall Street’s use of algorithms in “Black Box Trading”, to Netflix’s use of algorithms to influence what movie we watch next, to the household robotic vacuum “Roomba” using algorithms within the realm of architecture. Whether it is something more complicated at work, or just another common moment of our lives, we see algorithms working discreetly. These examples alone make it quite clear that algorithms are not simply “the math that computers use to decide stuff”, but that they are far more complex, sophisticated, and to an extent, almost natural in that they can do things that humans cannot put their finger on, grasp, and explain.

     While yes, it is obvious that humans created, understand and can explain how Netflix knows that I would probably enjoy “The Wire” after I just tackled two seasons of “House of Cards” in a single weekend, there have been algorithms created which have done things that even their creators cannot explain. For example, Slavin refers back to Wall Street and to an incident known as the “Flash Crash of 2:45” which took place on May 6, 2010 when within five minutes, nine percent of the entire United States stock market disappeared. What exactly happened? Nobody is really sure. Where exactly did it go? Nobody is really sure. Why did it happen? Same answer. There is no clear-cut conclusion that is agreed upon by a majority which leads us to believe that at that point in time the algorithm took over, essentially did whatever it wanted and no human predicted it, or could stop it. This example supports Kelvin’s hypothesis that humans are writing codes that we can no longer completely read and that we are really losing the sense of what is actually happening. There is actually company called Nanex, whose purpose is to find these nearly illegible algorithms, “pin them to the wall like a butterfly,” and try to figure out what exactly they mean and do. It is almost as if this company is trying to figure out the anatomy and makeup of these algorithms similar to how we study nature in our college sciences courses. Some questions I have are, how far do we continue going in creating these complex things that we could quite possibly have no control over? Are we beginning to create new mathematics in which we are testing the waters and letting the prospective benefits outweigh the possible costs? Sure, we have a pretty good grasp over them now, but as these algorithms become more complex and powerful, where does the future lead? But ultimately, have we found something else that is created and then can act on its own, the same way we procreate and have children with their own genetic makeup, who grow to eventually be able to make their own decisions and shape the future?

      As Slavin said, “the landscape was always made by this sort of weird, uneasy collaboration between nature and man. But now there’s this third co-evolutionary force: algorithms... And we will have to understand those as nature, and in a way, they are.”

algorithm

View Kevin Slavin's How Algorithms Shape Our World at:

How to Build an Area chart in Windows Forms

$
0
0

[youtube] width="560" height="315" src="http://www.youtube.com/embed/MgMO5WU8VwI" [/youtube]

In this video we're going to do a quick tutorial on building an area chart with the new Infragistics Windows Forms Chart Control. Let's go ahead and start a new project. You'll notice that I'm using Visual Studio Community Edition 2013. You can use this with the free edition and everything works as it would in the ultimate edition. Let's go ahead and call this Chart Sample Windows Forms.

I'm going to do a couple of things here. First thing I'm going to do is make my screen a little bit bigger, set some properties on my screen. My form 1, I want to make sure that the startup position of the window is going to be in the center. I also have a class to add. This class is going to include data that we're going to bind to our chart. Let's go ahead and grab this class I have here in Notepad++. You can see that it's just called Energy Production Sample. I have a type of energy production in those fields--region, country and then the type of energy production--coal, oil, gas, nuclear, hydro, etc. This is what we're going to bind to the actual chart. Let me copy this, and we'll create Class Energy Production Data.

Now that I have this pasted in, everything looks good. I'm going to go ahead and save. We'll go back to our form. What I want to do is add a chart to the form. We'll go ahead and grab an UltraChart. What the UltraChart did is it added the Win.data visualization assembly, the ultra-data chart assembly, and the Win.portable.core assembly. Those are now available to me in this project. The next step  ... Let's dock this. We do a full screen to fill the chart into the form.

Now for the chart itself I could to the properties. You can see we have all the properties listed out in the property window. Or I could just right click and go to custom property pages, which is a little bit easier because we have the properties categorized, and it's a little bit easier to find stuff. The first thing I'm going to do is set a title for my chart. I'm going to call this Energy Production Data. We will do our subtitle and we'll say “by type of energy” like so. We can leave the font the same But you can see you have a lot of customization here based on how you actually want the chart to look visually.

But in order to get this chart rendered there's two things we have to set up, two collections. The first one is the axis collection. On a chart you have an x axis, a y axis, and then you have a series. The series ends up being the chart type. Let's scroll up here. You notice we have axis here, and it's a collection. I'm going to bring up its collection editor. Since I already know going into this we're going to do an area chart, we could do another chart type that has DateTime. For financial data we could do a polar series which would have x axis data, radius axis data.

What we're going to do is something fairly basic. I'm going to have a category x, and I'm going to have a numeric y. The numeric y data will show up on the left-hand side of the chart, and the x will show up on the bottom, and that's going to be the text data. The country information is going to come across the bottom, and the production numbers will come up on the left-hand side. You can also see that there's a set of properties here for the axis. Again, if we had a SQL data source or some other data source, we can easily bind it to the control.

Now we will set up our series. Let's scroll down to the series collection editor. This is very simple. I'm going to go ahead and tell it I want this area series, but you'll notice we have every other type of series that you would like here--column series, bar, line, etc., every financial series, every type of financial indicator. You name it, this chart has it. It's a very rich and robust chart. It's been in the market for years across all of our platforms be it WPF, Silverlight, JQuery, IOS , Android, and now Windows Forms. It has a lot of features, has all the basic business chart types, and then all of the more advanced chart types too as well as scientific charting.

Now that I've added my area series what I want to do is tell the x axis and the y axis on the area series what to display. I want it to display the category x I had set up in my axis collection and my numeric y. It's as simple as that. I've basically set up the properties on the chart to display my area chart series with an x axis and a y axis. Now we've got to go put some data into it. If I was using a SQL data source, I could simply go ahead and use the editor and set the properties right in my designer. But since I'm using my class, which we can look at here, our energy production data, I add my name space Infragistics models, and then I have my energy production data sample data that we're going to consume.

Let's go ahead and make sure we're using Infragistics dot models. In our constructor here we'll just go ahead and create our data source. This is going to be the new energy production data sample. Now that we've created an instance of the data that we want to bind, we want to go ahead and tell the x axis what to use and we want to tell the series what to use. In order to do that we're going to create an x axis object. It's going to be associated with the ultra data chart, which is what was on our form. Remember we had the axis collection. The axis type that we want is going to be the category x axis.

Let's go ahead and tell it to use category x axis, like so. Since, remember, this was a collection, we can just say use first or default. We have the axis that we actually want to bind data to. Now we want to tell it what label to use. This is going to use data from our collection. The label will be country. You'll notice I'm not getting all of my telasense. There's a reason for that, and we'll fix that in one second. I will say x axis.data source = data. Now we need the Infragistics.Win.data visualization name space introduced here. What that gives us is all of the types that we need to reference if we are creating objects based off of the chart.

Now we have our x axis bound to the country property and our data source of energy production data sample. Now we need to do the same thing for our series. In the same manner we're going to create a series object, and it is a part of thisultra-data chart dot series and It is “of type” of the type of series that we actually told it to use which was going to be the area series. Same thing, it's a collection. Let's go ahead and tell it which one to use. Now, In this case we have a property called the value member path. For the series what we want to do is we want to bind its value member path to the data that we want to display from the data source. In this case it's going to be “coal”. This will be coal production. We're just going to tell the series that its data source equals data. That's it. That's all we really need to do.

We've set up an instance of the data that we want to bind. We have our x axis data, which we're going to display. Remember that'll end up being on the bottom of the chart. Our y axis is going to be bound to the area series chart type, and that will display our data. If we go ahead and run this  and you'll see that we've got a beautiful area chart. We've got our title, our subtitle ... our coal production on the left-hand side, by country on the right. There you go. It's that easy to get a chart up and running in Visual Studio with the Infragistics Windows Forms Data Chart Control.

Weekly Roundup: .NET, jQuery, HTML

$
0
0

In the .NET, jQuery and HTML ecosystems, 2015 has been a year of exciting announcements. Among the various releases, teasers and previews, it’s been impossible to ignore the trend in Virtual developments (whether of the Machine or Reality kind). Some of these offerings still seem a little futuristic, and a little out of reach for the large majority of customers. Nonetheless, it’s exciting to catch a glimpse of what VR and VMs might look like in future and we can’t wait to see how these early developments will evolve over the coming months and years.

In this week’s roundup we’ll be looking in more depth at these Virtual developments, and also at Microsoft’s announcements about its new browser, Spartan. As usual, get back to us with your thought on these developments in the comments section below, we’d love to hear your take on events.

Mozilla adds VR support directly to Firefox Nightly builds

Over the last few months, the Mozilla Foundation has been working on a number of exciting projects to turn Virtual Reality on the web into an accessible reality. Until recently, VR developments lagged behind Firefox and VR fans had to wait to download a separate build when wanting to experience the medium. However, from now on WebVR will be developed in conjunction with other Firefox improvements, meaning Firefox Nightly builds will always be compatible with the latest VR technology.
Most users at present will approach WebVR with the Oculus Rift headset and this will still require an add-on and require users to open a non-e10s browser window. That said, it’s hardly a complicated process for those hoping to experience VR and Mozilla expect these minor hitches to be smoothed out in the near future.

"Beam me up Scotty": Holographics from Microsoft

This week Microsoft took the tech world by storm with the announcement of HoloLens, a headset which allows users to lay images over the world they see. Running on Windows 10, the headset promises a new way of interacting with technology and combining these with our real world experience.
For developers, this sets the next frontier of design; no longer will users interact with code and platforms through a mobile or desktop interface, but they’ll directly live the experience. This may be a real game-changer in the development world and bring unusual challenges as well as awesome opportunities.

Azure Updates: bigger, better, bolder

It’s been an exciting month for Microsoft with numerous updates and developments. It might be a little less sexy than HoloLens, but the updates they recently announced to the Azure Cloud are impressive. Now generally available, their G-series Virtual Machines offer the highest amount of SSD on any virtual machine in the public cloud, state of the art server processors and flash based storage.
What this means for the development community is faster deployment of applications, especially for resource intensive enterprise work involving big data and relational database servers.  

Famo.us joins jQuery Foundation

Famo.us got a lot of kudos for developing a 3D layout engine as well as a physics animation engine written for HTML5. With a free, Open Source platform, they allow users to build cross platform web Apps. The engine is complex and must take into account the additional physics involved in 3D.
They recently announced that they would join the jQuery Foundation - the people behind the popular jQuery JavaScript library. The main aim of the move is to make access to their engines easier and for developers to begin using the machines’ to begin building impressive, next generation jQuery widgets. Steve Newcomb, founder of Famo.us, is inspired by the challenge of building web Apps which can finally move beyond the constraints of the old-school layout engines which were just designed for simple text.
Offering Famo.us layout engines on jQuery will allow designers to build much more advanced web Apps, widgets and parts and bring web-layout into the twenty-first century.

Internet Explorer is dead, long live Spartan 

Last week, Microsoft announced that come the release of Windows 10, Internet Explorer would no longer be their default web browser. Replacing the long standing, sometimes loved, sometimes hated Internet Explorer is more than a rebranding exercise however. Spartan will be entirely built on HTML5 and offers a real break from the twenty years plus of Internet Explorer. Spartan will offer a cleaner, lighter, more modern interface, offline reading list, voice recognition and much, much more.


Many developers are skeptical of Internet Explorer, despite real improvements in its latest incarnations. Microsoft are hoping to bring back the critical mass to their browser with a fresh start however and we can’t wait to see how it will be adopted by the community.

Virtually everyone is going virtual

We all remember the science-fiction films that got us fascinated by technology in the first place - from Back to the Future to Star Trek. This week’s announcements bring back a bit of that childish amazement those films gave us. It’s early days but we’re certainly looking forward to see how things will evolve!

Viewing all 2398 articles
Browse latest View live


Latest Images