Quantcast
Channel: Infragistics Community
Viewing all 2398 articles
Browse latest View live

Android Increasing its Grip on Global Smartphone Market

$
0
0

The Android operating system is showing no signs of relinquishing its control of the global smartphone industry. Although competition like iOS and Windows Phone is trying to cut into Android's impressive market share, doing so will likely be even more difficult than previously imagined.

A recent IDC report said that more than 236 million smartphones were shipped during the second quarter of 2013, up 51.3 percent from the same period in 2012. Of these, Android accounted for 187.4 million units and 79.3 percent of the market, up from roughly 69 percent the previous year.

Shipments of the iPhone increased year over year, but Apple's overall share of the market declined from 16.6 percent to 13.2 percent. Ramon Llamas, research manager at IDC, said the dip in iOS can be attributed to the iPhone's yearly cycle.

"Without a new product launch since the debut of the iPhone 5 nearly a year ago, Apple's market share was vulnerable to product launches from the competition," Llamas said. "But with a new iPhone and revamped iOS coming out later this year, Apple is well-positioned to re-capture market share."

Although a new iPhone will generate buzz among consumers and employees alike, it is clear that Apple has plenty of work on its hands if it truly wants to challenge Android for smartphone supremacy.

Mobile App Development is Given New Meaning

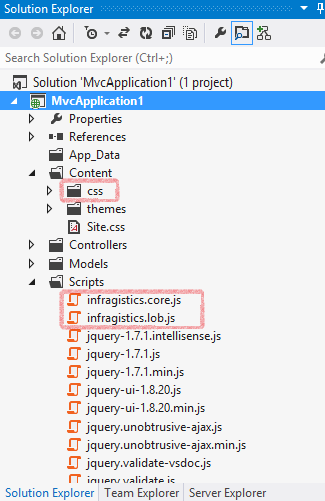
Organizations supporting bring-your-own-device (BYOD) initiatives likely have plenty of workers using Android-powered smartphones to access corporate data. Firms looking for ways to support these employees should consider using free tools such as Android controls in order to create highly visual and native business apps for the Android platform. These apps can be tailor-made to further corporate goals and ensure personnel are productive anywhere, regardless of their physical location.

Android Shipments Approaching 1 Billion

A Gartner report indicated that Android-powered devices will total nearly 867 million units in 2013, exceeding 1 billion in 2014. Windows devices will be No. 2 during this time, followed by iOS and Macs.

Carolina Milanesi, research vice president at Gartner, said each platform is trying to assert itself in each area of the mobile industry.

"Apple is currently the more homogeneous presence across all device segments, while 90 percent of Android sales are currently in the mobile phone market and 85 percent of Microsoft sales are in the PC market," Milanesi said.

The Android operating system may have come after the likes of iOS, but it has proven to be a force throughout the mobile market. As the platform becomes even more of an industry staple, businesses should consider creating their very own mobile applications native to Android. Android controls are not only easy to use, but are free as well, helping companies reduce costs by supporting BYOD and not having to hire expensive professionals to develop custom-built apps. 


Creating an image gallery with Tile Manager

$
0
0

The Ignite UI Tile Manager control is a layout control that gives a friendly, interactive user interface, that allows users to move the items on the page, to expand and collapse them.

In this blog you will see how to create an image gallery using Ignite UI Tile Manager and File Upload controls.

Step One: Setting the basis

To get started you need to insert Infragistics library Infragistics.Web.Mvc.dll. As we are making an ASP.NET MVC project using Razor, the inclusion will look like this:

  1. @using Infragistics.Web.Mvc;

Most MVC projects has jQuery scripts already included in itself, so you don’t have to worry about that. What you need to do is include the Infragistics scripts and of course append Infragistics CSS folder and scripts to your project folders. The following shows how to do it:

  1. <linktype="text/css"href="@Url.Content("~/Content/css/themes/infragistics/infragistics.theme.css")"rel="stylesheet"/>
  2. <linktype="text/css"href="@Url.Content("~/Content/css/structure/infragistics.css")"rel="stylesheet"/>
  3. <scripttype="text/javascript"src="@Url.Content("~/Scripts/infragistics.core.js")"></script>
  4. <scripttype="text/javascript"src="@Url.Content("~/Scripts/infragistics.lob.js")"></script>


Step Two: The File Upload

The Ignite UI File Upload control allows you to make a single or multiple upload. You just have to add these lines:

  1. <divid="uploader">
  2.      @(Html.Infragistics().Upload()
  3.     .ID("igUpload1")
  4.     .AddClientEvent("fileUploaded","UpHand")
  5.     .AutoStartUpload(true)
  6.     .ProgressUrl("/IGUploadStatusHandler.ashx")
  7.     .Render()
  8. )

We use the AddClientEvent to trigger a reload on Uploaded event. You can read how to do that later in the blog. The client-site of the configuration is the easy part, now let’s look at the server-site configuration. Shortly, what you need to do is:

  • Ignore the URL of the HTTP handler in Global.asax
  1. public static void RegisterRoutes(RouteCollection routes)
  2. {
  3.     routes.IgnoreRoute("IGUploadStatusHandler.ashx");
  4.     . . .
  5. }
  • Create a folder for your uploaded files and register it in Web.config
  1. <appSettings>
  2.   <addkey="fileUploadPath"value="~/Uploads"/>
  3.   <addkey="maxFileSizeLimit"value="100000000"/>
  4.   . . .
  5. </appSettings>
  • Register the module and the handler in Web.config
  1. <system.webServer>
  2.   <modulesrunAllManagedModulesForAllRequests="true">
  3.     <addname="IGUploadModule"type="Infragistics.Web.Mvc.UploadModule"
  4.                                preCondition="managedHandler"/>
  5.   </modules>
  6.   <handlers>
  7.     <addname="IGUploadStatusHandler"path="IGUploadStatusHandler.ashx"verb="*"
  8.          type="Infragistics.Web.Mvc.UploadStatusHandler"preCondition="integratedMode"/>
  9.   </handlers>
  10.   <validationvalidateIntegratedModeConfiguration="false"/>
  11. </system.webServer>

If you need more detailed information on how to set up the File Upload, you can read the blog “Using jQuery Upload Control and HTML5 Video Player to create Video Gallery” or you can look up the features and the samples of the control.

Step three: The Tile Manager

Tile Manager is a wise choice if you want an interactive layout for your gallery. This control is still CTP, that is why you may experience difficulties with some of its functions. The new release is coming soon,so if there are changes in the configuration we will let you know.

To start with, you need to add a div tag for your image dashboard in your HTML code.

  1. <divid="dashboard"></div>

Then you need to add the following jQuery code snippet, that demonstrates how to initialize the igTileManager control:

  1. function callTileManager () {
  2.     $('#dashboard').igTileManager({
  3.         layoutConfiguration: {
  4.             gridLayout: {
  5.                 columnWidth: 300,
  6.                 columnHeight: 250,
  7.                 marginLeft: 10,
  8.                 marginTop: 10
  9.             }
  10.         },    
  11.         animationDuration: 1000,
  12.         dataSource: dataSource,
  13.         contentTemplate: '<img src="${path}" />'
  14.        
  15.     });
  16. }
  17. callTileManager();

As you can see we are taking the data source from a variable called dataSource. Our data is actually an array of objects, which has two elements a name and a path. For that purpose you have to create a new model called GalleryItems.cs like that:

  1. publicclassGalleryItems
  2. {
  3.     publicstring path { get; set; }
  4.     publicstring name { get; set; }
  5.   
  6. }

Then you need to go to the HomeController.cs and set the gallery source.You made a new model that is why you have to include it in HomeController.cs:

  1. publicActionResult Index()
  2. {
  3.  
  4.     var model = newList<GalleryItems>();
  5.  
  6.     string[] paths = System.IO.Directory.GetFiles(Server.MapPath("~/Uploads"));
  7.  
  8.     for (int i = 0; i < paths.Length; i++)
  9.     {
  10.         model.Add(newGalleryItems()
  11.         {
  12.             path = "/Uploads/" + System.IO.Path.GetFileName(paths[i]),
  13.             name = System.IO.Path.GetFileNameWithoutExtension(paths[i])
  14.         });
  15.  
  16.     }
  17.  
  18.     return View(model);
  19. }

The code is in Razor, but we need it in our jQuery code that is why the variable dataSource must be JSON encoded.

  1. var dataSource =@Html.Raw(Json.Encode(Model));

The last step of the configuration is to set up the handler that triggers when a new item is added. Therefor, you have to make an AJAX request and if the request completes correctly you should be able to bind the new data.

  1. function UpHand(evt,ui) {       
  2.     $.ajax({
  3.        type: "POST",
  4.        url: "@Url.Action("Image","Home")",
  5.        data: {image: ui.filePath}
  6.     }).done(function (data) {
  7.         dataSource.push(data);
  8.         $("#dashboard").igTileManager("destroy");
  9.         callTileManager ();      
  10.        }        
  11. )};

For the data source you need to create a new control in the HomeController.cs:

  1. publicJsonResult Image(string image)
  2. {
  3.     var model = newGalleryItems()
  4.     {
  5.         path = "/Uploads/" + System.IO.Path.GetFileName(image),
  6.         name = System.IO.Path.GetFileNameWithoutExtension(image)
  7.     };
  8.     return Json(model);
  9. }

So this is how to make an image gallery with Tile Manager. The sample of the above mentioned source can be found here.


You can follow us on Twitter @Infragistics and stay in touch on Facebook, Google+ and LinkedIn!

Why Software Developers Should Prototype

$
0
0

Any developer that has been through the ringer before knows the pain that comes from undoing the hard work of developing back-end code and creating awesome UIs when stakeholders change the vision of their project.  Instead of suffering this cruel fate, developers can utilize tools that allow them to prototype their design. This way, UIs can be changed by stakeholders before developers start coding, thus saving lots of time and effort.


Why Prototype? an Infographic by Indigo Studio: Infragistics Prototyping

<a href="http://www.infragistics.com/community/blogs/gradientgirl/archive/2013/09/23/why-software-developers-should-prototype.aspx"><img src="http://www.infragistics.com/community/cfs-filesystemfile.ashx/__key/CommunityServer.Blogs.Components.WeblogFiles/gradientgirl/4666.Indigo_2D00_infographic_2D00_950.jpg" alt="Why Prototype?" border="0" /></a></code></p>
<br />
<p></p>
<p><a href="http://www.infragistics.com/community/blogs/gradientgirl/archive/2013/09/23/why-software-developers-should-prototype.aspx">Why Prototype?</a> an Infographic by <a href="http://www.infragistics.com/products/indigo-studio">Prototyping Tool</a> Indigo Studio</p>

Download Indigo Studio Version 2, and start saving a lot of time and preventing a lot of headaches when creating UIs.

Five Guiding Principles for Usability Testing

$
0
0

Usability testing has long been used as an essential tool for user experience and user interface designers. Even with the most ideal requirements and the perfect project team, nothing compares to getting a product in front of real people for testing. Despite its simple nature, usability testing can be difficult to implement correctly. Here are five of our top tips on conducting great usability sessions:

1. Choosing the Right Subjects

The key here is that the results will only be as good as the people you test. If you pick a set of subjects who are completely unfamiliar with the system being tested, your results will likely be worthless.

When all is well, you will have developed ‘personas’ during the requirements or development process of the project. A persona is a realistic representation of a key audience segment for your website or service. Sets of personas are helpful when deciding on features to implement or functionality to design, as they give you a user reference point to consider.

When it comes to usability testing, it’s essential to try to match subjects against these personas. If you don’t have personas created for your product, now is a good time to write them, or at least create simple versions to help you decide who good subjects for testing will be.

2. Wording Tasks

When you are writing out tasks your subjects will carry out during testing, think about a court trial and examination by counsel. A loaded question, such as “is this feature fantastic?” is inherently biased, and the subjects answer will naturally be affected. Tasks should be simple, clear and free from your own (or your team’s) personal feelings. For example:

“Review the homepage and explain what elements catch your eye” is much more effective than, “Can you see the big banner at the top of the homepage?”

“Review the steps of the checkout process and rate the experience of each screen from 1 to 5, five being the best” will serve you better than, “Is the last step of the checkout process too complex? We think the icons are very small.”

3. How to Behave During a Session

If you are helping out in the session itself, such as getting subjects in and settled, handing out tasks, answering queries or taking notes, then you have to be especially careful. You need to say and do as little as possible, do not distract the subject, and don’t chip in during tasks, even if you know how to do them and the subject is struggling. In order to prevent yourself interfering with your own test, remember these three golden rules:

  • Don’t speak until you are spoken to.
  • Sit down during the session, ideally not directly behind or over the shoulder of the subject.
  • Only help the subject with practical things like logging on or system crashes. If they can’t complete a task, do not help them.

4. Recording Sessions and Feedback

The person running the task should be able to take notes, but they can expect to be busy with admin tasks and helping the subject, so it is best if you video record the session. The most effective usability results come from recordings of both the user (their reactions and body language) and the screen (movement of mouse and interactions with the system). The first recording can be done with a simple camera and tripod, or even an iPhone if you have nothing else. The second type of recording can be achieved with any number of desktop recording software packages, ranging from free, to feature packed premium purchases.

It goes without saying that you should get written consent to be recorded from each person before the session begins.

5. Gathering Feedback After a Session

Immediately after the session is finished and the subject has completed all tasks, be sure to conduct a quick interview or survey. This is a great way to capture really useful feedback, and questions can be tailored to what happened in the particular session. It is also a great way to get quotes or sound bites from attendees.

XamDockManager - Data Binding ContentPanes with MVVM

$
0
0

If you are using the Infragistics xamDockManager control and using MVVM to compose your views, then you have probably asked yourself the question, “How do I data bind a collection of objects, which represent my Views, from my ViewModel to various areas of the xamDockManager?”.  You are asking yourself this question because the xamDockManager doesn’t support this data binding out of the box.  The good news is that this is relatively easy to accomplish.  You just have to write a little code.  As with most solutions, there are always more than one way to solve a problem.  There are actually solutions to this specific problem that have already been posted.  For example, this post titled “ItemsSource for xamDockManager”, provides an alternative to the solution I am going to show you.  So why am I showing you another approach?  Well, I prefer something a little more simple and straight forward.  You can choose which solution you prefer.

In this post, I will be adding the required MVVM support to the WPF version of the xamDockManager, and we will be using a Behavior to do it.  My Behavior is going to target a TabGroupPane as my container of choice.  What I mean by “container of choice”, is that I am going to have all my Views data bound and hosted inside of a TabGroupPane.  You may choose something different, such as adding support to the xamDockManager directly, or maybe use the DocumentContentHost.  What ever floats your boat!

Now, this behavior should support a couple of different scenarios.

  • I should be able to data bind a collection of objects, which will represent a view, from a ViewModel
  • I should be able to add new objects to this collection and have the View be shown in a new tab in the xamDockManager
  • I should be able to remove an existing object from the collection and have the View removed from the xamDockManager
  • I should also be able to close a tab and have the object automatically removed from the collection
  • I should be able to provide a DataTemplate to define the structure of the object as the View (implicit or explicit)
  • I should be able to provide a property path to use as the tab header text
  • I should be able to provide a DataTemplate to define the structure of the tab header

That about wraps it up.  Wow, that’s a lot of stuff, but nothing a simple Behavior can’t solve for us.  I would like to note that I am not concerned with removing objects from one collection and adding them to another collection in my ViewModel when dragging and dropping tabs around the xamDockManager.  If you want that, you will have to add that functionality yourself.  I am just going to provide you with the behavior, then talk about it.

publicclassTabGroupPaneItemsSourceBehavior : Behavior<TabGroupPane>
{
    publicstaticreadonlyDependencyProperty HeaderMemberPathProperty = DependencyProperty.Register("HeaderMemberPath", typeof(string), typeof(TabGroupPaneItemsSourceBehavior));
    publicstring HeaderMemberPath
    {
        get { return (string)GetValue(HeaderMemberPathProperty); }
        set { SetValue(HeaderMemberPathProperty, value); }
    }

    publicstaticreadonlyDependencyProperty HeaderTemplateProperty = DependencyProperty.Register("HeaderTemplate", typeof(DataTemplate), typeof(TabGroupPaneItemsSourceBehavior), newPropertyMetadata(null));
    publicDataTemplate HeaderTemplate
    {
        get { return (DataTemplate)GetValue(HeaderTemplateProperty); }
        set { SetValue(HeaderTemplateProperty, value); }
    }

    publicstaticreadonlyDependencyProperty ItemsSourceProperty = DependencyProperty.Register("ItemsSource", typeof(IList), typeof(TabGroupPaneItemsSourceBehavior), newPropertyMetadata(null, newPropertyChangedCallback(OnItemsSourcePropertyChanged)));
    publicIList ItemsSource
    {
        get { return (IList)GetValue(ItemsSourceProperty); }
        set { SetValue(ItemsSourceProperty, value); }
    }

    privatestaticvoid OnItemsSourcePropertyChanged(DependencyObject d, DependencyPropertyChangedEventArgs e)
    {
        TabGroupPaneItemsSourceBehavior behavior = d asTabGroupPaneItemsSourceBehavior;
        if (behavior != null)
            behavior.OnItemsSourcePropertyChanged((IList)e.OldValue, (IList)e.NewValue);
    }

    void OnItemsSourcePropertyChanged(IList oldValue, IList newValue)
    {
        AssociatedObject.Items.Clear();

        if (oldValue != null)
        {
            var oldCollectionChanged = oldValue asINotifyCollectionChanged;
            if (oldCollectionChanged != null)
                oldCollectionChanged.CollectionChanged -= CollectionChanged_CollectionChanged;
        }

        if (newValue != null)
        {
            var collectionChanged = newValue asINotifyCollectionChanged;
            if (collectionChanged != null)
                collectionChanged.CollectionChanged += CollectionChanged_CollectionChanged;

            foreach (var item in newValue)
            {
                ContentPane contentPane = PrepareContainerForItem(item);
                AssociatedObject.Items.Add(contentPane);
            }
        }
    }

    publicstaticreadonlyDependencyProperty ItemTemplateProperty = DependencyProperty.Register("ItemTemplate", typeof(DataTemplate), typeof(TabGroupPaneItemsSourceBehavior), newPropertyMetadata(null));
    publicDataTemplate ItemTemplate
    {
        get { return (DataTemplate)GetValue(ItemTemplateProperty); }
        set { SetValue(ItemTemplateProperty, value); }
    }

    void CollectionChanged_CollectionChanged(object sender, NotifyCollectionChangedEventArgs e)
    {
        if (e.Action == NotifyCollectionChangedAction.Remove)
        {
            IEnumerable<ContentPane> contentPanes = XamDockManager.GetDockManager(AssociatedObject).GetPanes(PaneNavigationOrder.VisibleOrder);
            foreach (ContentPane contentPane in contentPanes)
            {
                var dc = contentPane.DataContext;
                if (dc != null&& e.OldItems.Contains(dc))
                {
                    contentPane.ExecuteCommand(ContentPaneCommands.Close);
                }
            }
        }
        elseif (e.Action == NotifyCollectionChangedAction.Add)
        {
            foreach (var item in e.NewItems)
            {
                ContentPane contentPane = PrepareContainerForItem(item);
                if (contentPane != null)
                    AssociatedObject.Items.Add(contentPane);
            }
        }
    }

    protectedContentPane PrepareContainerForItem(object item)
    {
        ContentPane container = newContentPane();

        container.Content = item;
        container.DataContext = item;

        if (HeaderTemplate != null)
            container.HeaderTemplate = HeaderTemplate;

        if (ItemTemplate != null)
            container.ContentTemplate = ItemTemplate;

        container.CloseAction = PaneCloseAction.RemovePane;
        container.Closed += Container_Closed;

        CreateBindings(item, container);

        return container;
    }

    privatevoid Container_Closed(object sender, PaneClosedEventArgs e)
    {
        ContentPane contentPane = sender asContentPane;
        if (contentPane != null)
        {
            contentPane.Closed -= Container_Closed; //no memory leaks

            var item = contentPane.DataContext;

            if (ItemsSource != null&& ItemsSource.Contains(item))
                ItemsSource.Remove(item);

            RemoveBindings(contentPane);
        }
    }

    privatevoid CreateBindings(object item, ContentPane contentPane)
    {
        if (!String.IsNullOrWhiteSpace(HeaderMemberPath))
        {
            Binding headerBinding = newBinding(HeaderMemberPath);
            headerBinding.Source = item;
            contentPane.SetBinding(ContentPane.HeaderProperty, headerBinding);
        }
    }

    privatevoid RemoveBindings(ContentPane contentPane)
    {
        contentPane.ClearValue(ContentPane.HeaderProperty);
    }
}

As you can see we have only a couple of properties.  The HeaderMemberPath is used to specify the property path of the underlying object to use as the text for the tab header.  The HeaderTemplate property is used to control the structure of the tab header.  For example, maybe we want to add images or change other aspects of the tab header.  Next, we have the ever popular ItemsSource property.  You will use this property to data bind your collection of objects from your ViewModel to the TabGroupPane of the xamDockManager.  Notice how I am using IList as the property type.  This allows us to add and remove items from the collection.  Lastly, we have the ItemTemplate property.  This property will allow us to provide a DataTemplate to define the structure of each of the items in the collection.  Now keep in mind, the ItemTemplate will only really work if all the objects in your collection are the same.  If you have a collection of different object types, then you will not be using the ItemTemplate property.  Feel free to add more properties and modify this behavior to fit your specific needs.

The Sample

So how do you use this behavior?  Well let’s start with a ViewModel.

publicclassViewModel
{
    publicObservableCollection<object> People { get; set; }

    publicDelegateCommand InsertCommand { get; set; }
    publicDelegateCommand RemoveCommand { get; set; }

    public ViewModel()
    {
        People = newObservableCollection<object>();
        People.Add(newPerson() { FirstName = "Brian", LastName = "Lagunas", Age = 66 });

        InsertCommand = newDelegateCommand(Insert);
        RemoveCommand = newDelegateCommand(Remove);
    }

    publicvoid Insert(object param)
    {
        People.Add(newPerson() { FirstName = String.Format("First {0}", DateTime.Now.Second), LastName = String.Format("Last {0}", DateTime.Now.Second), Age = DateTime.Now.Millisecond });
    }

    publicvoid Remove(object param)
    {
        var person = param asPerson;
        if (person != null)
            People.Remove(person);
    }
}

This is a very straight forward ViewModel.  It has a single collection and two commands.  One command will insert a new Person object into my collection and the other command will remove an instance of a Person object from the collection.  Speaking of the Person object, let’s take a look at it.

publicclassPerson
{
    publicstring FirstName { get; set; }
    publicstring LastName { get; set; }
    publicstring FullName { get { returnString.Format("{0}, {1}", LastName, FirstName); } }
    publicint Age { get; set; }
}

Notice how I am not implementing INotifyPropertyChanged.  This is only because this is meant to be sample code and not meant to replicate a production system.  When you do this, make you’re your ViewModels and POCOs implement INotifyPropertyChanged. 

Next, let’s define our behavior in our View.  Since we are using a Behavior, you need to add a reference to System.Windows.Interactivity to your WPF application and add an namespace in your XAML.

<Window x:Class="XamDockManager_MVVM.MainWindow"
        xmlns="http://schemas.microsoft.com/winfx/2006/xaml/presentation"
        xmlns:x="http://schemas.microsoft.com/winfx/2006/xaml"
        xmlns:i="http://schemas.microsoft.com/expression/2010/interactivity"
        xmlns:igWPF="http://schemas.infragistics.com/xaml/wpf"
        xmlns:local="clr-namespace:XamDockManager_MVVM"
        Title="MainWindow" Height="350" Width="525">
    <Grid>
        <Grid.RowDefinitions>
            <RowDefinition Height="Auto" />
            <RowDefinition Height="*" />
        </Grid.RowDefinitions>

        <Menu>
            <MenuItem Header="Insert" Command="{Binding InsertCommand}" />
            <MenuItem Header="Remove" Command="{Binding RemoveCommand}" CommandParameter="{Binding ActivePane.DataContext, ElementName=_dock}" />
        </Menu>

        <igWPF:XamDockManager x:Name="_dock" Grid.Row="1" >
            <igWPF:XamDockManager.Panes>
                <igWPF:SplitPane>
                    <igWPF:TabGroupPane x:Name="_dynamicTab">
                        <i:Interaction.Behaviors>
                            <local:TabGroupPaneItemsSourceBehavior ItemsSource="{Binding People}"/>
                        </i:Interaction.Behaviors>
                    </igWPF:TabGroupPane>
                </igWPF:SplitPane>
            </igWPF:XamDockManager.Panes>
        </igWPF:XamDockManager>

    </Grid>
</Window>

Let’s run the application and see what we have so far.

image

That’s cool and all, but our objects don’t really looks like views right now, and what’s up with the tab header?  Let’s start using some of those properties we created to make this look a litle better.  Let’s start with the header.  I want to bind the tab header to the FullName property of our Person object.  I also want to make some changes to the formatting of the tab header so I am going to create a new DataTemplate for it.  I am also going to define an DataTemplate to use as the ItemTemplate for my Person object.

<Window x:Class="XamDockManager_MVVM.MainWindow"
        xmlns="http://schemas.microsoft.com/winfx/2006/xaml/presentation"
        xmlns:x="http://schemas.microsoft.com/winfx/2006/xaml"
        xmlns:i="http://schemas.microsoft.com/expression/2010/interactivity"
        xmlns:igWPF="http://schemas.infragistics.com/xaml/wpf"
        xmlns:local="clr-namespace:XamDockManager_MVVM"
        Title="MainWindow" Height="350" Width="525">

    <Window.Resources>

        <DataTemplate x:Key="HeaderTemplate">
            <TextBlock Text="{Binding}" FontSize="18" FontWeight="Bold" />
        </DataTemplate>

        <DataTemplate x:Key="PersonTemplate">
            <Border BorderBrush="Blue" BorderThickness="2">
                <Grid Margin="10">
                    <Grid.RowDefinitions>
                        <RowDefinition Height="Auto"/>
                        <RowDefinition Height="Auto"/>
                        <RowDefinition Height="Auto"/>
                    </Grid.RowDefinitions>
                    <Grid.ColumnDefinitions>
                        <ColumnDefinition Width="Auto"/>
                        <ColumnDefinition Width="*"/>
                    </Grid.ColumnDefinitions>
                    <TextBlock Text="First Name: " />
                    <TextBox Grid.Column="1" Text="{Binding FirstName}" />
                    <TextBlock Grid.Row="1" Text="Last Name: " />
                    <TextBox Grid.Row="1" Grid.Column="1" Text="{Binding LastName}" />
                    <TextBlock Grid.Row="2" Text="Age: " />
                    <TextBox Grid.Row="2" Grid.Column="1" Text="{Binding Age}" />
                </Grid>
            </Border>
        </DataTemplate>

    </Window.Resources>

    <Grid>
        <Grid.RowDefinitions>
            <RowDefinition Height="Auto" />
            <RowDefinition Height="*" />
        </Grid.RowDefinitions>

        <Menu>
            <MenuItem Header="Insert" Command="{Binding InsertCommand}" />
            <MenuItem Header="Remove" Command="{Binding RemoveCommand}" CommandParameter="{Binding ActivePane.DataContext, ElementName=_dock}" />
        </Menu>

        <igWPF:XamDockManager x:Name="_dock" Grid.Row="1" >
            <igWPF:XamDockManager.Panes>
                <igWPF:SplitPane>
                    <igWPF:TabGroupPane x:Name="_dynamicTab">
                        <i:Interaction.Behaviors>
                            <local:TabGroupPaneItemsSourceBehavior HeaderMemberPath="FullName"
                                                                   HeaderTemplate="{StaticResource HeaderTemplate}"
                                                                   ItemsSource="{Binding People}"
                                                                   ItemTemplate="{StaticResource PersonTemplate}"/>
                        </i:Interaction.Behaviors>
                    </igWPF:TabGroupPane>
                </igWPF:SplitPane>
            </igWPF:XamDockManager.Panes>
        </igWPF:XamDockManager>

    </Grid>
</Window>

Let’s see what we have with our changes.

image

Now that’s better!  You don’t have to use the ItemTemplate property.  If you have a collection of objects, for example ObservableCollection<object>, you can provide an implicit DataTemplate to the various types you are adding to the collection.  Maybe you have a DataTemplate for Person, and a different one for Car, and a different one for Pet.  You can create a different DataTemplate for each of these types and they will be rendered properly for each corresponding tab.

That’s wraps it up for this post.  Keep in mind that this post is mainly to help guide you in implementing MVVM with the xamDockManager control and you will probably have to modify this code to meet your specific needs.  Go ahead and download the source code for this post.  Feel free contact me on my blog, connect with me on Twitter (@brianlagunas), or leave a comment below for any questions or comments you may have.

Windows Phone Controls Help Companies Support a Mobile Workforce

$
0
0

The way employees get their work done has forever changed with the arrival of powerful mobile devices such as smartphones and tablets. Although operating systems like Android and iOS dominate many of the headlines in these markets, Microsoft continues to push forward with its Windows Phone platform in an effort to assert itself as the bonafide third option in the mobile arena.

Organizations looking for ways to support a mobile workforce and their employees who own a Windows Phone can develop custom-built, business-centered applications for these staff members. Infragistics' Windows Phone controls, for example, allow firms to develop highly visual apps that are native to Windows Phone devices.

Even companies that lack skilled personnel in mobile app development can use these tools because they are supported by vast network systems populated by seasoned developers. Users can even view sample code to make the creation process even easier.

Looking ahead, Windows Phone may continue to become more of a player in the bring-your-own-device (BYOD) movement. A recent IDC report said that more than 236 million smartphones were shipped during the second quarter of 2013, up 51.3 percent from the same period in 2012.

While Apple experienced a year-over-year decline in terms of shipments, Windows Phone had the largest growth of any operating system during the past year, expanding from 4.9 million units to nearly 9 million.

Meanwhile, Android remained at the top, accounting for more than 79 percent of second quarter shipments, increasing from approximately 69 percent from the previous year, according to IDC.

Things are Looking Up For Windows Phone

Other industry research has suggested that Windows Phone is trending upward. According to a report by Canalys, Android accounted for nearly 68 percent of all smartphone shipments in 2012, followed by iOS with approximately 20 percent, BlackBerry with just under 5 percent and Microsoft with 2.4 percent. By 2017, global smartphone shipments will total 1.5 billion units, with iOS declining to 14.1 percent and Windows Phone approaching 13 percent.

For Windows Phone to be a viable platform in the near future, it must be scalable, according to Jessica Kwee, a Canalys analyst.

"'Nokia is the most active vendor in the Microsoft camp and it continues to make steady progress with its Lumia portfolio," Kwee said. "It has had some major carrier wins recently in the two largest markets of China and the United States, which will help it build momentum in the short term."

Ryan Reith, program manager of IDC's mobility tracker programs, said Windows Phone shipments surpassed BlackBerry last quarter, and this continued during the second quarter of 2013. Nokia is a major driver behind Windows Phone as a whole, with Reith explaining that the research firm expects this to continue moving forward.

Reith concluded that as more manufacturers develop Android-based smartphones, the attention placed on Windows Phone will likely grow as people look for different options.

Developer Humor: Grandpa's Technology

$
0
0

Take a peek at this week's Developer Humor... Grandpa's Technology!

Developer Humor: Grandpa's Technology by Infragistics WinForms Controls

Embed image on your site by copying code below:

<a href="http://www.infragistics.com/community/blogs/marketing/archive/2013/09/25/developer-humor-grandpa-39-s-technology.aspx"><img src="http://www.infragistics.com/community/cfs-filesystemfile.ashx/__key/CommunityServer.Blogs.Components.WeblogFiles/marketing/4666.Grandpas_5F00_Technology_5F00_01.jpg" alt="Software Developer Comics" border="0" /></a></code></p>
<br />
<p></p>
<p><a href="http://www.infragistics.com/about-us/career-opportunities/">Software Developer</a> comics by Infragistics <a href="http://www.infragistics.com/products/windows-forms/">WinForms Controls</a> Team</p>

First open presentation about Indigo Studio v.2 in Sofia, Bulgaria - Event Recap

$
0
0

In Sofia, Bulgaria was organized a public presentation about Indigo Studio v.2. This was the first such presentation of the innovative product for UX in Central and Eastern Europe. The event was held on Wednesday, September 26th at Infragistics Bulgaria Office, 110B, Simeonovsko Shosse Bul., Sofia, Bulgaria.

I had the honor to present Indigo Studio as a lecturer.


Presentations was titled "Rapid Prototyping for Developers with Indigo Studio v.2" and presented the advantages of the product, which can benefit in particular for software developers.


Lecture presented Indigo Studio as a tool for creating storyboards, wireframes, prototyping and new features were demonstrated in version 2 like new touch gestures, screen-to-screen transitions, interactive iOS controls, export to PDF etc. .  I hope this is a good start to promote this product in the region.


Pictures from the Indigo Studio event in Sofia


You can check some awesome prototypes like this one here:

As always, you can follow us on Twitter @mihailmateev and @Infragistics and stay in touch on Facebook,Google+andLinkedIn!


Fundamentals of Python: Function and Variable Types (Week 3)

$
0
0

This week’s worth of lessons is super intuitive and really sets the tone for the rest of the class. As you’ll see, the speed of new information as well as the course structure meld together in a pretty harmonious way and let the student actually grasp concepts before moving on. While some of these are review if you’ve been following me since my last class, as always I enjoy a good subject matter comparison between languages. :)

If you need access to Week 1 or Week 2, here they are!

Lesson 1: Functions, Variables & The Call Stack

The call stack holds what are known as “stack frames” which basically represent the order in which different actions will be executed by the computer.

This is important to note when answering the question of what variable to use when there is a program with multiple instances of the same variable. The correct answer is the variable that’s in the stack frame, or as I like to call it, the active variable. Regarding assignment states and variables, if a variable does not exist in the current stack frame, Python will create the variable so it can be used. :)

HOWEVER!

When a function exists, the frame for the function is erased and control passes back to the statement containing the function call. The return of the function call is whatever was returned by the function itself.

Lesson 2: type bool

Boolean values represent the binary concept of true/false. This lesson goes over, in a pretty comprehensive way, what they are and how to use them…

Boolean Operation

Symbol

Less Than

Greater Than

Equal To

==

Greater Than or Equal To

>=

Less Than or Equal To

<=

Not Equal To

!=


Additionally, there are logical operators, which you can use to create longer, more specific selections using Boolean expressions as their operands.

Logical Operation

Symbol

Not:

not

And:

and

Or:

or


If you’re using the logical operator “and,” both booleans must evaluate to the same result in order to be true.

If you’re using the logical operator “or,” at least one of the booleans must evaluate to true in order to be true.

Additionally, when using the logical operators that are evaluating naturally, the order of precedence is simply left to right.

Lesson 3: Converting Between int, str and float

Let’s just cover this visually, because I think it actually is way more intuitive that way than through text.

Convert an into into a str:

str(3) -> ‘3’

Convert a str into an int:

int(‘3’ * 5) -> 33333

Convert a str into an int into a str:

str(int(‘3’ * 5)) -> ‘33333’

Convert a float into a str:

str(4.6) -> ‘4.6’

Convert a str into a float:

float(‘456’) -> 456.0

Convert a str into an int:

int(‘hello’) -> ValueError (AKA Juuuuuuuuuuuust kidding you can’t do that! The conversion of str to into or float only works when numbers are the only items in the string!)

Lesson 4: Import: Using Non Built-In Functions

Python has hundreds of functions that are pre-built and at the disposal of the developer; however, you have to import them to be able to use them!

In Python, the items that you import are called modules. A module is a file containing function definitions and other statements. A Python file defines a module, for example, triangle.py defines the module ‘triangle.’

In order to import a module, you would use the following statement:

import module_name

In order to access a function that is housed within a module, you would use the following statement:

module_name.function_name

Lesson 5: if Statements

if expression:
    statement

The above is the simplest form of an if statement, which is basically a way to conditionally break up your program. Here’s an example using this simile form:

if time1 == time2:
   return “same time”

If a function ends without a return statement being executed, it will automatically return None.

If your conditional if statement has multiple conditions or items you want to account for, you have several options!

Option number 1 is “elif.” Elif works the same way as “if,” but it cannot exist without an if statement before it. You can have any amount of elifs to accompany your if, including 0.

Option number 2 is “else.” Like with elif, else must come after an if, but it can also come after all of your elifs as well. Clearly, this means it has to be the last item in any sequence of an if statement, but this makes sense because else simply encompasses any cases you haven’t specifically accounted for in your ifs or elifs.

Lesson 6: No if Required!

This lesson addresses the concept of… when you might not need to use an if statement! When is that? If you are to write an if with a Boolean, of course the else will be false! It’s the only other option.

For example… you could write:

if num % 2 == 0:
  return true
else:
   return false

OR!

You could write:

return num % 2==0

These two statements represent the same process; however, the second one is cleaner, and one could even say, optimized. J

Lesson 7: Structuring if Statements

It’s super easy to nest if statements, so you can set up a conditional tree and then have sub-conditions within any level. That’s all you need to know from here! A series of if, elif, else statements can be housed WITHIN a parent if, elif, or else.

Week 3 Summary

Week 3 was super intuitive and really nailed home the idea of if statements and how to transition between different types of data. There’s not much else to say really, except let’s get excited for Week 4!

Questions/Comments?

Feel free to comment here on my blog, or find me on Twitter @DokiDara.

By Dara Monasch

Tune In to the .NET Rocks Podcast

$
0
0

Microsoft's .NET platform is an important aspect of the Windows operating system, providing key functionality for common applications that run on the OS. According to Microsoft, .NET offers developers a steady programming model for creating highly visual user experiences and secure communication-based apps.

Those looking to learn more about .NET should consider listening to the weekly .NET Rocks podcast,hosted by Carl Franklin and Richard Campbell. The shows are geared toward both seasoned developers and those without extensive development backgrounds, and the podcast can be downloaded and listened to on portable media players.

Some of the previous podcasts include shows focused on topics such as Silverlight, Windows 8, cloud computing, automation deployment, big data and TypeScript, among many others. Upcoming podcasts include Instrumenting Production with Bob Uva, the show's 900th episode, Using Azure Blob Storage for Continuous Delivery with Guy Starbuck, NodeBots, ‘RobotsConf’ with Chris Williams, and Wireframing UIs the Right Way with Russ Unger.

Channeling that Knowledge into Creativity

After listening to the podcast enough, chances are you‘re going to want to channel all that knowledge into doing something awesome. Developers interested in creating .NET applications should consider solutions such as Infragistics' .NET Controls Suite, all of which is available for a free 30 day trial. These options allow users to create apps for any .NET platform, as well as hybrid-based HTML5 apps. With these tools, devs can produce highly visual apps that include grids and charts to support their businesses.

These solutions also support the latest Windows operating system, which has become quite touch-based. Today, more employees are using smartphones and tablets to access work-related content anywhere, regardless of physical location, through the Internet. .NET controls allow developers to create touch-based apps for the Windows platform without having extensive programming backgrounds or investing in complex tools.

For more details on the .NET platform and other trends throughout the programming world, tune in to the .NET Rocks podcast. 

iOS - Objective-C - Filtering a NSArray using NSPredicate

$
0
0
In this post, i'll walk you through how to filter an NSArray using NSPredicates. The first thing you'll need to decide is if you're filtering a number or a string. For strings, you can use any of the following filters: (NOTE: must be all caps) BEGINSWITH ENDSWITH LIKE MATCHES CONTAINS For numbers, you can use: != > >= < == Now that you know what kind of data you're going to filter on, we can build our predicate. Lets first assume we're filtering an array of strings: NSArray...(read more)

Book App – Persisting with NSCoding and Introducing IGGridView (Xamarin.iOS-Monotouch)

$
0
0

So for V0.2 we made some changes on how the application works before new development.  For the delegates the code was changed to use events to report out various results.   These can be seen in SimpleCaptureMetadataOutputObjectsDelegate and CoverUrlConnectionDelegate.   Aside from that, the project was restructured slightly but that is just a cosmetic change.

Onto the new development.


Persistence of DataModel

The first version of the app was just a scanner with a web look up and that was fine, but to make the application more useful we want to persist the information we get back.   So the main storage data object (Book.cs) has been modified to implement the NSCoding methods.  This was done in a manner consistent with an earlier post on NSCoding .

[Export("initWithCoder:")]
public Book (NSCoder coder)
{
   NSString isbn = (NSString)coder.DecodeObject (@"isbn");
   if (isbn != null)
   {
       this.ISBN = isbn.ToString ();
   } 
}

public override void EncodeTo (NSCoder coder)
{
   if (this.ISBN != null)
   {
      coder.Encode( new NSString (this.ISBN), @"isbn");
   }   
}

The code will ultimately be run on iOS so if we want to use strings in Xamarin.iOS, we need to wrap the string primitive in an NSString object for the persistence round trip.

With this interface / prototype implemented, we can use NSKeyedArchiver and NSKeyedUnarchiver to persist our underlying collection to the device.


Introduction of IGGridView 

Now that we can build data, we need a way to show it. So the project also adds the IGGridView, which is located in the IG.dll. (Download Trial Installer) We add the IGGridView and add columns to show the text and the image of the data object.

isbnColumn.HeaderText = "ISBN";
isbnColumn.Width = IGColumnWidth.CreateNumericColumnWidth(200);
_helper.ColumnDefinitions.Add (isbnColumn);

IGGridViewImageColumnDefinition imageColumn = new IGGridViewImageColumnDefinition ("CoverImage",IGGridViewImageColumnDefinitionPropertyType.IGGridViewImageColumnDefinitionPropertyTypeImage);
imageColumn.Width = IGColumnWidth.CreateNumericColumnWidth(200);
_helper.ColumnDefinitions.Add (imageColumn);

When a book is scanned the image and data is saved on the device. The IGGridView comes into view, it will load the data from the device. Hmm..it works but the data is a little thin. We could also work on the UI a bit to make the book display better. I also think it would be nice if all my devices shared the data, so I could scan with any iOS device and see the results on another.

So I think the next iteration would try to include:

1) A better UI. The one I have now is utilitarian, fine for debugging but can be nicer.

2) Sharing data between devices via cloud storage

3) Maybe I can find more data to make the data more substantial.

So please download the in process project.(Xamarin.iOS / C#)

Articles in this series

1) Using the iOS7 BarCode Scanner - Book App (Xamarin.iOS-Monotouch)

2) Book App – Persisting with NSCoding and Introducing IGGridView (Xamarin.iOS-Monotouch)

By Darrell Kress

How to build XAML Doughnut Chart

$
0
0

The Infragistics packages for WPF and Silverlight contain a lot of diverse charts for data visualization. The control that we are going to look at is The Doughnut Chart. This chart supports one or more rings surrounding a blank center. It can be customized by controlling the slices labels and colors or by configuring the inner radius. In this blog you can learn how to add this control to your application and how to create a custom hierarchical chart by using multiple rings.

XAML Doughnut Chart with custom brushes

Adding the Doughnut Chart

Generally, when you create your WPF project the first thing you need to do is to add the references. There is an easy way to do that:

  1. Go to the toolbox. There you will see the NetAdvantage WPF and Shared XAML controls.
  2. Drag and drop the “XamDoughnutChart”.

When you do those steps you will see that Visual Studio automatically adds the required Infragistics references.


When you dragged “XamDoughnutChart”, you actually created the needed tag to host our chart. The next step is to include the following code:

  1. <ig:XamDoughnutChart x:Name="slice">
  2.     <ig:XamDoughnutChart.Series>
  3.         <ig:RingSeries
  4.             LabelMemberPath="Label"
  5.             ValueMemberPath="productionShare"
  6.             LabelsPosition="BestFit"
  7.             ItemsSource="{Binding Mode=OneWay, Source={StaticResource source}}">
  8.         </ig:RingSeries>
  9.     </ig:XamDoughnutChart.Series>
  10. </ig:XamDoughnutChart>

The data source for the items is generated in the cs file of the page as follows:

  1. publicclassCategory
  2. {
  3.      publicstring Label { get; set; }
  4.      publicdouble productionShare { get; set; }
  5. }
  6.  
  7. publicclassHierarchalDataCollection : List<Category>
  8. {
  9.      public HierarchalDataCollection()
  10.      {
  11.          this.Add(newCategory { Label = "Footwear", productionShare = 46 });
  12.          this.Add(newCategory { Label = "Clothing", productionShare = 38 });
  13.          this.Add(newCategory { Label = "Accessories", productionShare = 16 });
  14.      }
  15. }


Basic XAML doughnut chart


Basically those are the steps to create a Doughnut Chart. Of course it has many options like legend, brush, slice Select and Slice Explode, which will make your chart even more attractive. More about the options you can find in the documentation. I will just give you a hint how to add a particular option. For example if you want to be able to select a slice and thus make it explode and change its style add the AllowSliceExplosion and AllowSliceSelection options and set their values to true. Then create a slice click event like that:

XAML:

  1. AllowSliceExplosion="True"
  2. AllowSliceSelection="True"
  3. SliceClick="slice_SliceClick"

C#:

  1. privatevoid slice_SliceClick(object sender, Infragistics.Controls.Charts.SliceClickEventArgs e)
  2. {
  3.     e.IsSelected = !e.IsSelected;
  4.     e.IsExploded = !e.IsExploded;
  5. }


Exploded XAML doughnut chart


Custom hierarchical  chart

When you need to visualize hierarchical data, you can use the multiple ring visualization of the chart. We are going to create three rings doughnut chart, which will display the main categories broken down into subcategories.  For that purpose we are going to create three series and define our data source like this:

XAML :

  1. <ig:XamDoughnutChart.Series>
  2.     <ig:RingSeries
  3.                                         StartAngle="30"
  4.         LabelMemberPath="Label"
  5.         ValueMemberPath="productionShare"
  6.         LabelsPosition="BestFit"
  7.         ItemsSource="{Binding Mode=OneWay, Source={StaticResource source}}"
  8.                             Loaded="RingSeries_Loaded">
  9.     </ig:RingSeries>
  10.     <ig:RingSeries
  11.                                         StartAngle="30"
  12.         LabelMemberPath="Label"
  13.         ValueMemberPath="productionShare"
  14.         LabelsPosition="BestFit"
  15.         Loaded="RingSeries_Loaded"
  16.                             OthersCategoryThreshold="0" >
  17.     </ig:RingSeries>
  18.     <ig:RingSeries
  19.                                         StartAngle="30"
  20.         LabelMemberPath="Label"
  21.         ValueMemberPath="productionShare"
  22.         LabelsPosition="BestFit"
  23.         OthersCategoryThreshold="0">
  24.     </ig:RingSeries>
  25. </ig:XamDoughnutChart.Series>

C# :

  1. publicclassHierarchalDataCollection : List<Category>
  2.     {
  3.         public HierarchalDataCollection()
  4.         {
  5.             
  6.             this.Add(newCategory { Label = "Footwear"});
  7.             this.Add(newCategory { Label = "Clothing"});
  8.             this.Add(newCategory { Label = "Accessories"});
  9.             this.Add(newCategory { Label = "Tech" });
  10.  
  11.             
  12.             this[0].Children.Add(newCategory { Label = "Boots" });
  13.             this[0].Children.Add(newCategory { Label = "Shoes" });
  14.             this[0].Children.Add(newCategory { Label = "Sneakers" });
  15.             this[0].Children.Add(newCategory { Label = "Slippers" });
  16.  
  17.             this[1].Children.Add(newCategory { Label = "Dresses" });
  18.             this[1].Children.Add(newCategory { Label = "T-shirts" });
  19.             this[1].Children.Add(newCategory { Label = "Shirts" });
  20.             this[1].Children.Add(newCategory { Label = "Pants" });
  21.  
  22.             this[2].Children.Add(newCategory { Label = "Bag" });
  23.             this[2].Children.Add(newCategory { Label = "Jewelry" });
  24.             this[2].Children.Add(newCategory { Label = "Scarf" });
  25.  
  26.             this[3].Children.Add(newCategory { Label = "PC"});
  27.             this[3].Children.Add(newCategory { Label = "Laptops"});
  28.             this[3].Children.Add(newCategory { Label = "Tablets"});
  29.             this[3].Children.Add(newCategory { Label = "Phones"});
  30.  
  31.             
  32.             this[0].Children[0].Children.Add(newCategory { Label = "B1", productionShare = 3 });
  33.             this[0].Children[0].Children.Add(newCategory { Label = "B3", productionShare = 3 });
  34.             this[0].Children[0].Children.Add(newCategory { Label = "B4", productionShare = 4 });
  35.  
  36.             this[0].Children[1].Children.Add(newCategory { Label = "S1", productionShare = 3 });
  37.             this[0].Children[1].Children.Add(newCategory { Label = "S2", productionShare = 5 });
  38.             this[0].Children[1].Children.Add(newCategory { Label = "S3", productionShare = 4 });
  39.  
  40.             this[0].Children[2].Children.Add(newCategory { Label = "Sn1", productionShare = 6 });
  41.             this[0].Children[2].Children.Add(newCategory { Label = "Sn2", productionShare = 9 });
  42.  
  43.             this[0].Children[3].Children.Add(newCategory { Label = "SL1", productionShare = 2 });
  44.             this[0].Children[3].Children.Add(newCategory { Label = "Sl2", productionShare = 4 });
  45.             this[0].Children[3].Children.Add(newCategory { Label = "Sl3", productionShare = 3 });
  46.  
  47.            
  48.             this[1].Children[0].Children.Add(newCategory { Label = "d1", productionShare = 3 });
  49.             this[1].Children[0].Children.Add(newCategory { Label = "d2", productionShare = 3 });
  50.             this[1].Children[0].Children.Add(newCategory { Label = "d3", productionShare = 2 });
  51.  
  52.             this[1].Children[1].Children.Add(newCategory { Label = "t1", productionShare = 5 });
  53.             this[1].Children[1].Children.Add(newCategory { Label = "t2", productionShare = 4 });
  54.             this[1].Children[1].Children.Add(newCategory { Label = "t3", productionShare = 2 });
  55.             this[1].Children[1].Children.Add(newCategory { Label = "t4", productionShare = 1 });
  56.  
  57.             this[1].Children[2].Children.Add(newCategory { Label = "sh1", productionShare = 3 });
  58.             this[1].Children[2].Children.Add(newCategory { Label = "sh2", productionShare = 3 });
  59.             this[1].Children[2].Children.Add(newCategory { Label = "sh3", productionShare = 2 });
  60.  
  61.             this[1].Children[3].Children.Add(newCategory { Label = "p1", productionShare = 4 });
  62.             this[1].Children[3].Children.Add(newCategory { Label = "p2", productionShare = 6 });
  63.  
  64.             
  65.             this[2].Children[0].Children.Add(newCategory { Label = "bag1", productionShare = 2 });
  66.             this[2].Children[0].Children.Add(newCategory { Label = "bag2", productionShare = 1 });
  67.             this[2].Children[0].Children.Add(newCategory { Label = "bag3", productionShare = 4 });
  68.  
  69.             this[2].Children[1].Children.Add(newCategory { Label = "j1", productionShare = 3 });
  70.             this[2].Children[1].Children.Add(newCategory { Label = "j2", productionShare = 2 });
  71.  
  72.             this[2].Children[2].Children.Add(newCategory { Label = "sc1", productionShare = 1 });
  73.             this[2].Children[2].Children.Add(newCategory { Label = "sc2", productionShare = 1 });
  74.             this[2].Children[2].Children.Add(newCategory { Label = "sc3", productionShare = 1 });
  75.             this[2].Children[2].Children.Add(newCategory { Label = "sc4", productionShare = 1 });
  76.  
  77.             
  78.             this[3].Children[0].Children.Add(newCategory { Label = "pc1", productionShare = 3 });
  79.             this[3].Children[0].Children.Add(newCategory { Label = "pc2", productionShare = 2 });
  80.             this[3].Children[0].Children.Add(newCategory { Label = "pc3", productionShare = 5 });
  81.  
  82.             this[3].Children[1].Children.Add(newCategory { Label = "l1", productionShare = 4 });
  83.             this[3].Children[1].Children.Add(newCategory { Label = "l2", productionShare = 3 });
  84.  
  85.             this[3].Children[2].Children.Add(newCategory { Label = "tab1", productionShare = 4 });
  86.             this[3].Children[2].Children.Add(newCategory { Label = "tab2", productionShare = 3 });
  87.             this[3].Children[2].Children.Add(newCategory { Label = "tab3", productionShare = 3 });
  88.             this[3].Children[2].Children.Add(newCategory { Label = "tab4", productionShare = 3 });
  89.  
  90.             this[3].Children[3].Children.Add(newCategory { Label = "ph1", productionShare = 2 });
  91.             this[3].Children[3].Children.Add(newCategory { Label = "ph2", productionShare = 3 });
  92.             this[3].Children[3].Children.Add(newCategory { Label = "ph3", productionShare = 2 });
  93.             this[3].Children[3].Children.Add(newCategory { Label = "ph4", productionShare = 1 });
  94.         }
  95.     }


Now we have all of the data that we want to visualize. As we are making it look hierarchical it would be nice if the different slices for every category have similar color. What we are going to do is take the basic brush from the innermost ring and lighten it with every step. In the following code you can see that first we figure out how many children does the ring have and then we create a collection of brushes that will be a perfect match for the children.

  1. privatevoid RingSeries_Loaded(object sender, RoutedEventArgs e)
  2. {
  3.     var ringSeries = (sender asRingSeries);
  4.     var count = ringSeries.Ring.ArcItems[0].SliceItems.Count();
  5.     var brushes = ringSeries.Brushes;
  6.     BrushCollection brushesMatch = newBrushCollection();
  7.  
  8.     for (var i = 0; i < count; i++)
  9.     {
  10.         var childrenCount = (ringSeries.ItemsSource asList<Category>)[i].Children.Count();
  11.         var child = (ringSeries.ItemsSource asList<Category>)[i].Children;
  12.  
  13.         var brush = brushes[i];
  14.  
  15.         for (var j = 0; j < childrenCount; j++)
  16.         {
  17.             double step = 1 / (double)childrenCount;
  18.             Random rand = newRandom();
  19.                 double val = (1 + j) * step - .3;
  20.  
  21.                 brushesMatch.Add(brush.GetLightened(val));
  22.         }
  23.     }
  24.  
  25.     ringSeries.Chart.Series[ringSeries.Ring.Index + 1].Brushes = brushesMatch;
  26. }


Custom Hierarchial Doughnut Chart

Depending on the data you are going to display, you can change the way the children are colored, for instance you can brush them in random  tint. No matter  what kind of brush you use- Solid, Radial or Linear Gradient the GetLightend extension method will handle it.

  1. privatevoid RingSeries_Loaded(object sender, RoutedEventArgs e)
  2. {
  3.     var ringSeries = (sender asRingSeries);
  4.     var count = ringSeries.Ring.ArcItems[0].SliceItems.Count();
  5.     var brushes = ringSeries.Brushes;
  6.     BrushCollection brushesMatch = newBrushCollection();
  7.  
  8.     for (var i = 0; i < count; i++)
  9.     {
  10.         var childrenCount = (ringSeries.ItemsSource asList<Category>)[i].Children.Count();
  11.         var child = (ringSeries.ItemsSource asList<Category>)[i].Children;
  12.  
  13.         var brush = brushes[i];
  14.  
  15.         for (var j = 0; j < childrenCount; j++)
  16.         {
  17.             Random rand = newRandom();
  18.  
  19.             if (j % 2 == 0)
  20.             {
  21.                 double val = Math.Round((rand.NextDouble() / 4), 2);
  22.                 brushesMatch.Add(brush.GetLightened(-val));
  23.             }
  24.             else
  25.             {
  26.                 double val = Math.Round((rand.NextDouble() / 3), 2) + 0.2;
  27.                 brushesMatch.Add(brush.GetLightened(val));
  28.             }
  29.         }
  30.     }
  31.  
  32.     ringSeries.Chart.Series[ringSeries.Ring.Index + 1].Brushes = brushesMatch;
  33. }


Random lighten hierarchical doughnut chart


If you want to learn more about the doughnut chart you can check out the product’s page or read my blog:”The Ignite UI Doughnut Chart and its features”.


A WPF sample and Silverlight sample.

You can follow us on Twitter @Infragistics and stay in touch on Facebook, Google+ and LinkedIn!

Windows Azure Website issue with Portable class library

$
0
0

I was developing a website that had common logic held in a portable class library. However when I used Git deployment, the compilation on the Azure servers would fail with:
The reference assemblies for framework ".NETPortable,Version=v4.5,Profile=Profile78" were not found.

After much debugging it seems the issue is that the Azure build servers don’t have all the PCL profiles. As a shot term fix, you can go into your PCL properties, and remove support for Windows Phone 8. I changed my project to only support Windows 4.5 & Windows store, and this resolved the issue.

By David Burela

How to make an image gallery with Ignite UI Tile Manager–release 13.2

$
0
0

If you have read my previous blog about Infragistics’ Tile Manager control, you know that this layout control provides a user-friendly interface and allows you to rearrange your images the way you want. In this blog we are going to see what are the changes in the new release. In the last release this control was CTP, but now it is already RTM and it is fully functional. Basically this layout control displays data into tiles and every tile can represent different content depending on its state – minimized or maximized. The minimized state looks like this:

Tile Manager minimized style

When you select a particular picture it enlarge and the panel separates in two parts –a  left panel which displays the tile you have selected and a right panel which contains the other pictures. The right panel has a scrollbar which allows you to scroll the minimized tiles. Using the splitter bar between those panels you can resize both sides of the layout.

When it comes to  the code there are few basic steps you need to follow:

1. Create a div tag element to host your layout.

  1. <divid="dashboard"></div>

2. Add the control:

  1. $(function () {
  2.     $('#dashboard').igTileManager({
  3.         rightPanelTilesWidth: 300,
  4.         rightPanelTilesHeight: 160,                
  5.         marginLeft: 10,
  6.         marginTop: 10,
  7.         dataSource: dataSource,                
  8.         minimizedState:'<img src="${path}" />',
  9.         maximizedState:'<h3>${name}</h3><img src="${path}" />'
  10.     });
  11. });

3. The implementation of the data source and the file upload control stay the same as in the previous sample .The only change is the event handler function.

  1. function UpHand(evt,ui) {       
  2.     $.ajax({
  3.         type: "POST",
  4.         url: "@Url.Action("Image", "Home")",
  5.         data: {image: ui.filePath}
  6.     }).done(function (data) {
  7.         console.log(data);
  8.         dataSource.push(data);
  9.         $("#dashboard").igTileManager("option","dataSource",dataSource);
  10.     }
  11.     )};

That’s it! Now you have a beautiful layout for your app.  You can use the different options that the control offers, like animation duration to make your tiles change faster or use the column width and height to specify the height and width of each column in the container. If you need more information about how to add this control to your application read my previous blog or check out the documentation.


Tile Manager

Sample.


You can follow us on Twitter @Infragistics and stay in touch on Facebook, Google+ and LinkedIn!


SQLSaturday #199 Bulgaria Event Recap and Follow-up

$
0
0

After the first successful SQLSaturday # 152 in 2012  Infragistics was host and sponsor the conference in SQLSaturday #199   for the second time.

SQLSaturday #199 Bulgaria was held on 26 of October, 2013  at Infragistics Bulgaria office: 110 B, Simeonovsko Shosse Bul., Office Floors II and III


Sofia has a history of over 2,000 years


Infragistics Bulgaria Office

IG_5F00_Office_5F00_011_5F00_134F0E06[1]IG_5F00_Office_5F00_031_5F00_45D26B78[1]


What is SQL Saturday:

Infragistics as a company that develops solutions for data visualization and business solutions has many common points in with areas covered from the  conference: BI, Reporting, SQL Server related solutions

Our plan was to have:

  • More than 200 attendees
  • Up to 30 sessions in 5 Tracks
  • More than 15 speakers


Registration:


Keynote:


Volunteers from Infragistics


Sessions:


Sponsors:


Lunch:


SQLSaturday Raffle:


The actual statistics looks much better than SQLSaturday Bulgaria Team Expected


Our statistics:

  • 350 registrations.
  • 210 real attendees from 11 countries (USA, UK, Portugal, Poland, Holland, Belgium, Turkey, Ukraine, Russia, Bulgaria and Serbia).
  • 20 speakers from 10 different countries (USA, UK, Portugal, Poland, Holland, Belgium, Turkey, Ukraine, Russia and Bulgaria).
  • 30 sessions in 5 tracks


You can see more pictures from the conference here:

Feedbak in Twitter about SQLSaturday #199 Bulgaria


Some Twitter statistics  about SQLSaturday #Bulgaria 2013

Infragistics participation in the event:

The conference schedule is available here:

Now SQLSaturday Bulgaria Team is looking for appropriate dates for SQLSaturday Bulgaria 2014.

More information about SQLSaturday Bulgaria is available  on the website of the conference http://www.sqlsaturday.com/199SQL Saturday Bulgaria Facebook page and you can follow #sqlsat199 on Twitter.

Follow news from Infragistics for more information about new Infragistics events.

As always, you can follow us on Twitter @mihailmateev and @Infragistics and stay in touch on Facebook, Google+ andLinkedIn!


Warm Regards,
SQLSaturday Bulgaria Team


  Saturday

How to express your data using Ignite UI’s jQuery Linear Gauge control.

$
0
0

When it comes to Data Visualization, there is an abundance of controls in the Ignite UI package, which can help you provide the best user interface. Depending on the type of information you wish to display you can choose which chart to use. In the new release of Ignite UI there are few new controls and the one we are going to focus on in the current blog is the Linear Gauge. It supports a great amount of options and features , by the use of which you can customize this chart and adapt it to your data.

basic linear gauge


Basic Configuration

If you consider adding this control to a HTML page then you will need an element on which to instantiate the control.

HTML:

  1. <divid="linearGauge"></div>

After that include the following JS  code:

JS:

  1. $("#linearGauge").igLinearGauge({
  2.     width: "500px",
  3.     height: "80px",
  4.     minimumValue: "0",
  5.     maximumValue: "50",
  6.     value: "20"
  7. });


Example image:

linear gauge

If you are making a MVC project first add the Infragistics references and then use the following lines:

MVC:

  1. @(Html.Infragistics().LinearGauge()
  2.         .Width("100%")
  3.         .Height("80px")
  4.         .MinimumValue(0)
  5.         .MaximumValue(40)
  6.         .Value(22)
  7.         .Render()
  8. )

Those are the basic steps to configure the control. Of course you can add some options to the configured chart to make it correspond to your ideas. We are going to cover few of the options that Linear Gauge supports, but the entire list of features you can find in the API documentation.

Features

As we said the igLinearGauge control is an Ignite UI control which displays data in a form of linear gauge. It consists of visual elements like scale, needle, ranges and labels. All of those elements can be customized.

Scale

The scale is composed of tick marks and labels. The size and the positions of the tick marks are relative to the Graph area(a frame of reference for positioning the visual elements of the scale). There are quite a few options related to the scale. For example you can decide whether you want your scale to be inverted or not by setting the isScaleInverted option to ‘true’ or ‘false’. You can manipulate the position of the scale using the scaleStartExtend and scaleEndExtend , having in mind that both- start position and the end position of the scale are relative to the left edge of the graph area. To specify the value range you need to use the maximumValue and minimumValue options and assign them the values you wish. You can set a background color with the backingBrush option.

JS:

  1. minimumValue: "0",
  2. maximumValue: "50",
  3. scaleEndExtent: ".7",
  4. scaleStartExtent: ".2",
  5. isScaleInverted: "true",
  6. backingBrush: "#99CCFF"

MVC:

  1. .MinimumValue(0)
  2. .MaximumValue(50)         
  3. .BackingBrush("#99CCFF")
  4. .IsScaleInverted(true)
  5. .ScaleEndExtent(.7)
  6. .ScaleStartExtent(.2)

Example image:

inverted linear gauge


Ticks by themselves can be customized in few different ways. You can change the main ticks brush using the tickBrush option or you can change the mini ticks brush by the minorTickBrush option. You can also change the thickness of the main brushes by assinging them the desired value using the tickStrokeThickness option and respectively the mini brushes using minorTickStrokeThickness. The number of mini ticks that are displayed can be changed with minorTickCount.

JS:

  1. tickStrokeThickness: 4,
  2. minorTickBrush: "blue",
  3. tickBrush: "yellow",
  4. minorTickCount: 5

MVC:

  1. .TickStrokeThickness(4)
  2. .TickBrush("yellow")
  3. .MinorTickBrush("blue")
  4. .MinorTickCount(5)

Example image:

linear gauge with custom ticks


Needle

To configure the needle actually means to set its shape, size and position. The position is set by the value option and the size can be changed by needleStrokeThickness option. The shape can be: “needle”, “triangle”,”rectangle”, “trapezoid” and the option that is used is needleShape. If you want a specific shape you can set this option to “custom” and then by using the following options you can create your own needle.

JS:

  1. value: "20",
  2. needleShape: "custom",
  3. needleInnerExtent: 0.3,
  4. needleOuterExtent: 0.7,
  5. needleOuterPointExtent: 0.9,
  6. needleInnerPointExtent: 0.3,
  7. needleInnerPointWidth: 0,
  8. needleOuterPointWidth: 0.3,
  9. needleInnerBaseWidth: 0,
  10. needleOuterBaseWidth: 0.07,
  11. needleBrush:"lightpink"

MVC:

  1. .NeedleShape(LinearGraphNeedleShape.Custom)
  2. .NeedleBrush("lightpink")
  3. .NeedleInnerExtent(0.3)
  4. .NeedleOuterExtent(0.7)
  5. .NeedleOuterPointExtent(0.9)
  6. .NeedleInnerPointExtent(0.3)
  7. .NeedleInnerPointWidth(0)
  8. .NeedleOuterPointWidth(0.3)
  9. .NeedleInnerBaseWidth(0)
  10. .NeedleOuterBaseWidth(.07)

Example image:

custom needle


Ranges

The igLinearGauge control supports multiple relative ranges. Each range can be configured individually by specifying its starting and ending value , brush and border thickness.

JS:

  1.   ranges: [
  2. {
  3.     name: 'first',
  4.     startValue: -275,
  5.     endValue: -192.5,
  6.     outerStartExtent: .7,
  7.     outerEndExtent: .55
  8. },
  9. {
  10.     name: 'second',
  11.     startValue: -192.5,
  12.     endValue: -82.5,
  13.     outerStartExtent: .55,
  14.     outerEndExtent: .35
  15. },
  16. {
  17.     name: 'third',
  18.     startValue: - 82.5,
  19.     endValue: 0,
  20.     outerStartExtent: .35,
  21.     outerEndExtent: .25
  22. }
  23.   ]

Example picture:

temperature

You can achieve the sloping effect for scale by changing the outer extent options. The Linear Gauge can be either horizontal or vertical. This change can be made by orientation option:

JS:

  1. orientation: "vertical"

Example image:

vertical linear gauge


Labels

Changing the label color can be done by fontBrush option. If you want your label to be more than numbers you can use the following event and change the it.

  1. formatLabel: function (evt, ui) {
  2.     ui.label += 'Kilos';
  3. }


custom labels

The position of the labels can be modified with labelExtent . This option gets or sets the position on which to put the label as a value from 0 to 1, measured form the bottom of the scale.

custom scale


Tooltips are always useful and you can have tooltips when you hover the needle or when you hover a particular area of the chart. If you want to enable the tooltips – first set the showTooltip option to true and then use the needleToolTipTemplate or the rangeToolTipTemplate like this:

JS:

  1. <!--Needle ToolTip-->
  2. <scriptid="needleToolTip"type="text/x-jquery-tmpl">
  3.     <divclass='ui-lineargauge-needle-tooltip'>
  4.         <span>The needle is on : ${label}</span>
  5.     </div>
  6. </script>
  7.  
  8. <!--Range ToolTip-->
  9. <scriptid="rangeToolTip"type="text/x-jquery-tmpl">
  10.     <span>Range: ${item.startValue} to ${item.endValue}</span>
  11. </script>

  1. showToolTip: true,
  2. needleToolTipTemplate: "needleToolTip",
  3. rangeTooltipTemplate: "rangeToolTip",

Example image:


Conclusion

The igLinearGauge control gives you the ability to create attractive data presentations and it provides a simple and concise view of a primary value compared against a scale. This jQuery UI widget visualize data in the form of a linear gauge. Like a classic thermometer, these gauges can read out one or more values over a straight line measurement scale that you can orient vertically or horizontally.

Sample.

Coming soon a sample showing the dynamic use of this control.


You can follow us on Twitter @Infragistics and stay in touch on Facebook, Google+ and LinkedIn!

Designing for Any Device

$
0
0

What follows is a primer for the professional who has been tasked with creating a web site or application that may be accessed via multiple devices (aka responsive design). Whether you are a product manager, user experience professional, designer or developer, follow these guidelines and your users will thank you.

Regardless of the platform(s), you must:

  1. Understand the technical requirements
  2. Understand the business requirements
  3. Understand the user requirements

Note that user requirements are morethan a list of new features and functionality! User requirements must include an understanding of how users work and what they are trying to accomplish through their interaction with the artifact you are creating. These include a user’s goals, their known/stated requirements as well as their latent requirements (i.e., requirements that users don’t realize they have). User requirements also include any device-specific constraints (physical or technological) that impact a user’s ability to interact with your artifact.

Informational or Marketing Web Sites

If a responsive design is your goal and the artifact is a straightforward informational or marketing web site, it is sufficient to focus primarilyon 1 and 2 above. Here is why:

  • Informational and marketing web site designs are well understood and have become commoditized. Care to guess the percentage of web sites today that were created using WordPress? The site w3techs.com puts the number at 20.4% of all existing web sites. It remains the task of the UX or design professional to determine the information architecture (a well understood process) but the “problem” of overall site layout, usability and design for simple sites has been largely solved.
  • The goal of such sites is to make all content available under all device constraints (though the device-specific prioritization of such content remains an important task that is routinely ignored).
  • Most importantly, device-specific design and layout decisions are made programmatically in order to support the goal of “one design to fit them all”.

Complex Transactional Web Sites or Business Applications

If a responsive design is your goal and the artifact is a complex, transactional web site or business application, following #3 above becomes critical. In this case, there are multiple sets of task- and device-specific requirements that need to be implemented. Here is why:

  • A user’s expectations, goals and tasks will vary as they move between physical environments.
  • A user’s expectations, goals and tasks will vary as they move between physical devices.
  • It is almost certainly nota requirement of the user to have all content available under all device constraints. Device-specific prioritization of content is critical.
  • Specific designs are required to match specific user requirements on specific devices.

In other words, tasks and processes that may be well-supported in an office environment may be completely inappropriate if translated verbatim to a non-office environment, regardless of device. This isn’t simply a matter of knowing what content to hide or expose. Depending on situational requirements, certain tasks may be done differently, incompletely or not at all. Key to creating an application that alwayssupports users is understanding how and when a user’s requirements change.

Responsive design is a misnomer. It is a development technique. There are no such shortcuts to good design.


Kevin Richardsonhas been working in the area of user experience for over 20 years. With an advanced degree in Cognitive Psychology, he has experience across business verticals in the fields of research, evaluation, design and management of innovative, user-centered solutions.

Kevin’s experience includes web sites, portals and dashboards, enterprise software and custom business applications for medical, pharmaceutical, communications, entertainment, energy, transportation and government users.

On the weekends, you can find Kevin on his motorcycle, riding for Infragistics Racingat a number of different racetracks on the East coast.

IG Racing

Ember.js Basics - What is Ember?

$
0
0

According to the creators of the framework, Ember.js is “a framework for creating ambitious web applications”. What exactly do they mean? Also, with the many (, many, many) JavaScript frameworks that we have to choose from these days, why might I choose Ember? In this post, I’ll introduce Ember.js and some of the core concepts that backed its development. In future posts, I’ll dig in and show you how to build applications with the framework. For now, let’s look at what the framework is made of.

Guiding principles

Before looking at the details of any framework, it helps to understand the core concepts that drove the feature decisions in the first place. Perhaps the biggest factor in the creation of Ember was the belief that what makes the web so unique is the ability to bookmark and share URLs. The team felt that many JavaScript frameworks treated the URL as an afterthought (mostly by treating the concept of a router as an optional add-on). The Ember team also wanted to create an MVC framework that was closer in line with the desktop MVC framework mentality rather than taking a server-side MVC approach (like ASP.NET MVC or Ruby on Rails). So, Ember combines the productivity of a native UI framework while supporting shareable URLs. The following key concepts are what make up the framework from a high-level overview standpoint.

Core concepts

Naming conventions

Ember was written with convention over configuration in mind. This means that much of the framework relies on things being named consistently and in the manner that the framework expects. The naming conventions are summarized nicely here.

Templates

Templates are what describe the user interface in Ember.js. Ember templates are written using the Handlebars templating language which allows for expressions to be added to standard HTML markup within double curly braces: {{}}. Each template is backed by a model and supports databinding such that the template will auto-update when the model changes. The following features are supported in Ember’s Handlebars templates:

  • Plain HTML
  • Expressions - Allow model values to be substituted into the HTML. For instance, {{price}} would substitue the value of the price property on the model into the template where specified
  • Outlets - An outlet (specified by {{outlet}}) is a placeholder for another template. As the user moves around the application, different templates can be loaded into the outlet by the router.
  • Components - Custom HTML elements (technically, custom Handlebars helpers) that help clean up repetitive templates by enabling the creation of reusable controls

Example template:

Name: {{input type="text" value=name placeholder="Enter your name"}}

My name is {{name}} and I want to learn Ember!

Router

The router in Ember is what powers the shareable URLs that are so important to web applications. The router translates the URL of a request into a series of templates. For instance, when I visit /coffee within the application, Ember’s router will translate this to the CoffeeRoute which will set up the appropriate template backed by the appropriate model for that request. As the templates or models being shown to the user change, Ember’s router will automatically keep the URL in the browser up to date. This means that the user can share the URL at any point in the application lifecycle. Whenever someone clicks on this shared URL, they will see the same thing that the original user saw.

Example router:

App.Router.map(function() {
  this.resource('about');
  this.resource('coffees', function() {
    this.resource('coffee', {path: ':coffee_id'});
  });
});

App.CoffeesRoute = Ember.Route.extend({
  model: function () {
    return App.Coffee.find();
  }
});

Models

A model object is used to store persistent state within an Ember application. These model objects are what back the templates and provide data to be displayed within the HTML. Many applications will load these models through a REST API using Ember Data which will store the data in a server database, but Ember doesn’t limit you to just this choice. There are many adapters for Ember Data that allow you to choose the backend that works best for your project. You can even roll your own syncing using the Basic Adapter

Example model:

var attr = DS.attr;

App.Coffee = DS.Model.extend({
  name: attr('string'),
  price: attr('number'),
  ounces: attr('number'),
  description: attr('string'),
  roaster: attr('string'),
  acidity: attr('string'),
  body: attr('number')
});

Controllers

The controller is technically where the templates get their data from. Though optional, a controller will be created by Ember if not directly declared for a route. The controller “decorates” the model object. Properties specified on the controller can be accessed by a template as if they were declared on the model. Methods can be created within the controller that can be called using Handlebars helpers in the template. This enables things like button actions. In general, properties that do not need to be synced to the backend server but are necessary for template logic should be created in the controller. Ember supports the creation of ObjectControllers, which manages a single model object, and ArrayControllers which manage a list of model objects.

Example controller:

Todos.TodoController = Ember.ObjectController.extend({
  isCompleted: function(key, value){
    var model = this.get('model');

    if (value === undefined) {
      // property being used as a getter
      return model.get('isCompleted');
    } else {
      // property being used as a setter
      model.set('isCompleted', value);
      model.save();
      return value;
    }
  }.property('model.isCompleted')
});

Components

Components allow for the creation of reusable controls. The interface for the component is defined using Handlebars templates. The component also has a JavaScript class that is used to store state and handle user interaction. Components are placed into a template using a Handlebars helper with a name based off of the name of the component.

Example component:

App.GravatarImageComponent = Ember.Component.extend({
  size: 200,
  email: '',

  gravatarUrl: function() {
    var email = this.get('email'),
        size = this.get('size');

    return 'http://www.gravatar.com/avatar/' + hex_md5(email) + '?s=' + size;
  }.property('email', 'size')
});

Summary

Ember.js is a relatively young but growing framework. Though in the past it suffered from a lack of documentation and a difficult learning curve, that situation has improved dramatically. The Ember guides are very well-written and will help you get started with the framework in no time. I will also be posting more on how to develop with this framework over the coming weeks.

Contact

If you want to comment or reach out to me, the best place to do that is on Twitter @brentschooley. I can also be reached via email at bschooley@infragistics.com.

Creating a jQuery Music Player using the Ignite UI Linear Gauge.

$
0
0

The Linear gauge widget can be very handy if you want to create a custom music player. In this blog you can see how to use this control to build the volume slider and the player slider while making a Music player like the one described in O'Reilly’s jQuery Cook Book. The example picture demonstrates the final result.

Step one

First of all, we need some HTML tags to host our player elements. We are going to use the HTML5 audio tag to hold our song.

  1. <audiosrc="/Music/song.mp3"></audio>

Then we are going to set the basics for the player. We will need a play and pause button, a volume button and of course the controls for progress and volume. You can use some CSS to style those elements

  1. <divclass="musicPlayer">
  2.     <divclass="buttons">
  3.         <aclass="playpause"href="#">
  4.             <spanclass="ui-icon ui-icon-play"></span>
  5.             <spanclass="ui-icon ui-icon-pause"></span>
  6.             </a>
  7.     </div>
  8.     <spanclass="currenttime"></span>
  9.     <divid="linearGauge"></div>
  10.     <spanclass="duration"></span>
  11.     <divclass="volume-container">
  12.         <divclass="volume">
  13.             <ahref="#">
  14.                 <spanclass="vol ui-icon ui-icon-volume-on"></span>
  15.             </a>
  16.         </div>
  17.     </div>
  18.     <divid="linearGauge1"></div>
  19. </div>

Step two

Now that we have the construction of our music player let’s make it functional. First you will need the following code to enable the play and the pause buttons.

  1. $('.buttons .playpause').click(function () {
  2.     var player = $(this).parents('.musicPlayer');
  3.     if (player.is('.paused')) {
  4.         $('.musicPlayer').removeClass('paused');
  5.         audioEl.play();
  6.     } else {
  7.         $('.musicPlayer').addClass('paused');
  8.         audioEl.pause();
  9.     }
  10.     returnfalse;
  11. }).hover(function () { $(this).addClass('ui-state-hover'); },
  12. function () { $(this).removeClass('ui-state-hover'); })
  13. .focus(function () { $(this).addClass('ui-state-focus'); })
  14. .blur(function () { $(this).removeClass('ui-state-focus'); });
  15.  
  16. $('.musicPlayer').addClass('paused');

For the slider we are using the linear gauge. As you will see from the following lines, the maximum value for the control depends on the song’s duration. That way the chart will always respond to the length of the currently playing song. We will make two ranges: one static and one dynamic, which will change with the progress of the song.


  1. var newduration = audioEl.duration / 60;
  2.  
  3. //linear gauge
  4.  
  5. $(".musicPlayer #linearGauge").igLinearGauge({
  6.     width: "65%",
  7.     height: "45px",
  8.     minimumValue: "0",
  9.     maximumValue: newduration,
  10.     minorTickCount: 1,
  11.     needleBreadth: 4,
  12.     interval: 1,
  13.     value: 1.2,
  14.     labelInterval: 1,
  15.     needleShape: "custom",
  16.     needleInnerBaseWidth: 0.1,
  17.     needleOuterBaseWidth: 0.1,
  18.     needleInnerExtent: .6,
  19.     needleOuterExtent: 0.1,
  20.     needleInnerPointExtent: .3,
  21.     needleInnerPointWidth: 0.3,
  22.     needleOuterPointExtent: 0.4,
  23.     needleOuterPointWidth: .3,
  24.     needleBrush: "black",
  25.     backingBrush: "#e6e6e6",
  26.     backingOutline: "#e6e6e6",
  27.     fontBrush: "black",
  28.     ranges: [
  29.     {
  30.         name: "666",
  31.         startValue: 0,
  32.         endValue: newduration,
  33.         brush: "#666",
  34.         innerStartExtent: .2,
  35.         innerEndExtent: .2,
  36.         outerStartExtent: 0.5,
  37.         outerEndExtent: 0.5
  38.     }, {
  39.         name: "track",
  40.         startValue: 0,
  41.         endValue: 0,
  42.         brush: "#19A3A3",
  43.         innerStartExtent: .2,
  44.         innerEndExtent: .2,
  45.         outerStartExtent: 0.5,
  46.         outerEndExtent: 0.5
  47.     }]
  48. });

To take the duration of the tune you need to make sure that its metadata is loaded. To avoid divergence of time we are going to wrap the control in a function which will execute only after the loadmetadata event occurs.

  1. audioEl.addEventListener("loadedmetadata", function () {
  2.     . . .
  3. }

In this function we will initialize the handler function for the timeupdate event where we are going to change the value of the control because we want the needle to show the current time. The other change that we are making is update  end value of the dynamic range. Again, the value that we are assigning is the current time. That way we can color only the part of the scale that corresponds to the  elapsed time of the song.

  1. $('audio').bind('timeupdate', function (event) {
  2.     $('.musicPlayer .currenttime').text(minAndSec(audioEl.currentTime));
  3.     $(".musicPlayer #linearGauge").igLinearGauge("option", "value", audioEl.currentTime / 60);
  4.     $(".musicPlayer #linearGauge").igLinearGauge("option", "ranges", [{
  5.         name: "track",
  6.         endValue: audioEl.currentTime / 60
  7.     }]);
  8. });

In the same way you can add one more range to show the buffer progress.

We want to be able to change the current time of the tune, whenever we want. For that reason we will enable the needle to drag and we will  make audio element’s current time equal to the value at which we drag the needle to.

  1. var lastPointX = 0, lastPointY = 0, isDragging = false, lastPointXVol = 0, lastPointYVol = 0;
  2.  
  3. // Start the needle drag only on a mousedown on the needle
  4. document.getElementById("linearGauge").addEventListener("mousedown", function (e) {
  5.     dragNeedle(e, true);
  6.     document.addEventListener("mousemove", mousemove);
  7.     document.addEventListener("mouseup", mouseup);
  8.  
  9. });
  10.  
  11. // Function that performs the needle drag/tap to the new point
  12. dragNeedle = function (e, isMouseDown) {
  13.     if (!isMouseDown && !isDragging) {
  14.         return;
  15.     }
  16.  
  17.     e.preventDefault();
  18.     var pointX = e.pageX - $("#linearGauge").offset().left;
  19.     var pointY = e.pageY - $("#linearGauge").offset().top;
  20.     if (isMouseDown) {
  21.         var isClickPointValid = $("#linearGauge").igLinearGauge("needleContainsPoint", pointX, pointY);
  22.         if (isClickPointValid) {
  23.             lastPointX = pointX;
  24.             lastPointY = pointY;
  25.         } else {
  26.             isClickPointValid = $("#linearGauge").igLinearGauge("needleContainsPoint", (pointX + 4 * lastPointX) / 5, (pointY + 4 * lastPointY) / 5);
  27.         }
  28.         isDragging = true;
  29.         if (!isClickPointValid) {
  30.             isDragging = false;
  31.             return;
  32.         }
  33.  
  34.     }
  35.  
  36.     var value = $("#linearGauge").igLinearGauge("getValueForPoint", pointX, pointY);
  37.     if (isNaN(value))
  38.         return;
  39.  
  40.     // Prevent needle from dragging beyond the scale bounds
  41.     var minimumValue = $("#linearGauge").igLinearGauge("option", "minimumValue");
  42.     var maximumValue = $("#linearGauge").igLinearGauge("option", "maximumValue");
  43.  
  44.     var startValue = minimumValue <= maximumValue ? minimumValue : maximumValue;
  45.     var endValue = minimumValue > maximumValue ? minimumValue : maximumValue;
  46.  
  47.     if (value > startValue && value < endValue) {
  48.         $("#linearGauge").igLinearGauge("option", "value", value);
  49.         $(".musicPlayer #linearGauge").igLinearGauge("option", "ranges", [{ name: "track", endValue: value }]);
  50.         audioEl['currentTime'] = value * 60;
  51.  
  52.     } else {
  53.         value = value >= endValue ? endValue : startValue;
  54.         $("#linearGauge").igLinearGauge("option", "value", value);
  55.         $(".musicPlayer #linearGauge").igLinearGauge("option", "ranges", [{ name: "track", endValue: value }]);
  56.         audioEl['currentTime'] = value * 60;
  57.  
  58.     }
  59. }


Music Player

Step three

As our music player is already functional and playing the last thing to do is control the volume of the song. As we mentioned we are using another linear gauge to take care of the volume. As you can guess it is vertical and the range is set from 0 to 1. We use the hide and toggle jQuery functions to  make it appear only when the user click  on the volume icon.  In the range we set the end value to audio element’s volume.

  1. $("#linearGauge1").hide();
  2. $(".vol").click(function () { $("#linearGauge1").toggle(); });
  3. $("#linearGauge1").igLinearGauge({
  4.     width: "40px",
  5.     height: "110px",
  6.     minimumValue: "0",
  7.     maximumValue: "1",
  8.     orientation: "vertical",
  9.     minorTickCount: 1,
  10.     interval: 1,
  11.     tickEndExtent: 0.5,
  12.     scaleStartExtent: .1,
  13.     scaleEndExtent: 0.9,
  14.     value: 1,
  15.     fontBrush: "black",
  16.     ickStrokeThickness: 1,
  17.     labelInterval: 1,
  18.     backingBrush: "#B2CCCC",
  19.     ranges: [{
  20.         name: "volume",
  21.         startValue: 0,
  22.         endValue: audioEl.volume,
  23.         brush: "#D1E0E0",
  24.         outerStartExtent: 0,
  25.         outerEndExtent: 0.9
  26.     }]
  27. });

We need to be able to drag this needle if we want to change the volume. We use the same function as the above mentioned. The only difference is that we don’t set the current time but we set the volume making it equal to the value of the needle.

  1. audioEl['volume'] = value;


Volume


Conclusion

The linear gauge is not only a static control for Data Visualization, it can be dynamic and functional. You can use it to create music player, video player , thermometers and whatever else you can think of.  You can find more information about this control and how to add it to your application in my blog: “How to express your data using Ignite UI’s jQuery Linear Gauge control.”


Sample.


You can follow us on Twitter @Infragistics and stay in touch on Facebook, Google+ and LinkedIn!

Viewing all 2398 articles
Browse latest View live