Quantcast
Channel: Infragistics Community
Viewing all 2372 articles
Browse latest View live

Ship Something Yourself, and Help Your Career (Part 2)

$
0
0

In my last post, I urged you to start something that earned you money and get it to market as quickly as possible, talking about how it would start to change your life outside of work.  Today, I'll talk about how doing this in your spare time can actually help you with the work you're currently doing.  This happens in a few ways.

Diversifies Your Skillset

As a programmer, the majority of your time is spent pitted against an adversary that is sometimes frustrating, sometimes infuriating, but entirely predictable, at least with enough knowledge and practice.  Compilers, interpreters, frameworks, and runtimes are your delighted or frustrated, they’re always doing exactly what you tell them and you use silent, objective simultaneously your tools and your foes, but whether you’re feedback to wrangle them to your will.


Sure, you may have the occasional support ticket or feature request that involves dealing with the less predictable and subjective universe that is user interaction.  But, at the end of the day, you solve their problems by diving back into your world of silent, objective feedback and writing code.


But with online entrepreneurship, the world gets both messier and more interesting.  You make changes and those changes cause you to add or lose readers, users, viewers, or even money.  Put a “buy now” button on your product site, and observe that suddenly you’re making more money than yesterday.  This drives you to learn about new things like user psychology, marketing, and business strategy, but you get to learn about them in a very programmer-friendly way: with automated feedback like changes in views, hits, or money.  In a very real sense, you’re hacking the business world.

Encourages Empirical Thinking

In the world bounded by your IDE and debugging tools, your day is a series of experiments.  You’re thus no doubt wondering how I can say that things get more empirical when you charge into the arena of online entrepreneurship.  Well, the reason I say this is that, while code compiling and tests passing may be pretty cut and dried, most things beyond that kinda aren’t.


Who in your group has the title “senior” and who doesn’t?  What is that based on?  Who is the team leader or manager and why?  What was your last performance review like?  Was it fair?  Was the compensation adjustment based on it fair?  Was it tied to business profitability or was it arbitrary?


Organizations are large and complex, and with that comes a good bit of indirection when it comes to pecking order, titles, compensation and career.  Citizens of the corporate world learn that to get ahead, they need to pry their fingers away from the keyboard and pay attention to office politics, soft skills, and even things like how they dress.


Contrast that with what it means to get ahead when you’re earning money via online sales, readership or advertising.  Which font is the ‘right’ font to use on the landing page for your web app?   Only one way to find out – run some A/B testing for a week and see which one makes more money.  Run good experiments, get good results, get paid.  Your financial incentives are directly aligned with your ability to execute the scientific method and not with your ability to laugh at the boss’s jokes.

Imparts Business Sense Like No MBA Program Can


And finally, if you want to augment your development skills and advance your career, this is a trial by fire way to do it.  When you do this, you will, literally, be running a business, if a rather small one.  That means that you, as the proprietor, need to understand all aspects of how a business works.  But don’t worry, because it’s a just-in-time education that never overwhelms.


As you go on this journey, you’ll find that you suddenly understand previously foreign concepts such as market research, payment collection, accounts receivable and payable, advertising, P&L, and bunches more that I’ll elide for fear of boring you.  The point is that there’s no better way to learn the ins and outs of business than by running one.


Even if you don’t see middle management or running a startup in your future, the savvy can do nothing but help your career.  Whereas you might previously have shied away from it, you’ll now be able to feel comfortable going toe to toe with project managers and salespeople in company meetings since you will understand their worlds while they do not understand yours.  Even if you wish to remain entirely technical for the entirety of your career, this knowledge will serve you well as promotions are considered and leadership responsibilities doled out.

No Time Like the Present

So what are you waiting for?  Go out and get cracking.  It won’t take a whole lot of time to do something at least.  You can get going with relatively little effort and absolutely no risk, so why not give it a shot? 


Windows 10 RTM, Infragistics Support & Futures

$
0
0

Microsoft Windows 10 is officially launching today worldwide, and I wanted to take a minute to update you on what it means for Infragistics customers and where we are headed with this exciting new release.

Unlike previous release versions of Windows, the new operating system marks a "new era" for personal computing as Microsoft CEO Satya Nadella called it. To start with - it is built to run across all platforms. This means that Windows 10 will be used across all Microsoft devices, including PCs, tablets and smartphones, game consoles and wearables like Microsoft's holographic headset, HoloLens with developers only needing to write their applications once for all devices. The future opportunity for developers around Windows 10 is huge, lots of device support, lots of Infragistics support with controls, libraries, frameworks and productivity tools along the way.

Speaking about Windows 10, Satya Nadella said: "We want Windows to go from where users need it, to choose it... to loving it" reflecting on the new direction Microsoft has taken.  I am actually here in Redmond today on campus and the energy and excitement over Windows 10 RTM is amazing.  A very exciting day for Microsoft, but more so for developers who need a solid OS with a high adoption rate to deliver desktop, web and mobile apps for both consumers and the enterprise.

At Infragistics, we’ve always been committed to build software for you with the latest technologies available, and in the light of this major OS release from Microsoft, we are pleased to announce:

  • Infragistics products that are currently supported in our product lifecycle are fully supported on Windows 10.
  • Infragistics officially supports Visual Studio 2015, and CLR 4.6 for all products that are currently supported in their product lifecycle.

As the developer story evolves for building Windows 10 apps with the new Universal Windows Platform (UWP) evolves, expect to see announcements and product builds of our cross-platform UI controls for Windows 10 targeted apps later this year.  We are also announcing the retirement of our Windows 8 and Windows Phone controls today.  These products will have 3-year support from the launch of Infragistics 15.2 later this year, so for the customers that have apps migrating to UWP, you’ll have plenty of support from us along the way.

Stay tuned to the blogs for future products announcements around UWP, as well as the exciting upcoming 15.2 release in October.  And as usual, if you have any questions, feel free to shoot me an email at jasonb@infragistics.com.
 

How to perform a CRUD operation on the jQuery igGrid with the ASP.NET Web API

$
0
0


In this post we will learn how to perform a CRUD operation on the igGrid using the ASP.NET Web API, including:

·         Creating the ASP.NET Web API using the Entity Framework database first approach

·         Performing a CRUD operation on the igGrid in a jQuery application

At the end of the post we should able to create Web API for CRUD operations on the City entity and perform the CRUD operations from the igGrid.


Setting up the Database

Here we have a database with the table name City as shown in the image below:


We have created the database in SQL Server and the Web API will connect to the database using the Entity Framework database first approach.


ASP.NET Web API

Let us go ahead and create a Web API project in Visual Studio. To do this, select File->New Project-> Web Application as shown in the image below.


On the next window, select Web API template to create the Web API project.


Data Model

Once the project is created we need to create the data model. To create the data model we will follow the Entity Framework database first approach. To do this, right click on the Model folder in the project and select Add new item. In the Add new item window, from the data tab select ADO.NET Entity Data Model as shown in the image below:


On the next screen, select the “EF Designer from database” option.


On the next screen, click on the New Connection option. To create a new connection to the database we need to provide the database server name and choose the database from the drop down. Here we are working with the “School” database, so we’ve selected that from the drop down and provided the database server name which is djpc in my case.


After clicking OK, on the next screen, leave the default name of the connection string and click on next. On this screen we need to select the tables. We want to work with only the City table so check the check box for the city table. Leave the default for the other settings and click on Finish to create the data model.


Scaffolding the Web API

As of now we have created the data model which is ready to be used in the Web API. We have two options to create the Web API:

1.       Create the API Controller class manually

2.       Use Scaffolding to create the API controller class

Here we’ll use the scaffolding option to create the Web API.  Once the API is created we will modify the actions as required. To create the Web API using the scaffolding, right click on the Controllers folder and then select Add New Controller. In the installed template of controllers, select Web API 2 controller with actions, using Entity Framework as shown in the image below. 


On the Add Controller dialog option, select City class as the model class and SchoolEntities as the Data context class and click on Add.


Once we click on Add, Visual Studio will create the Web API for CRUD operations on the City entity. In the controllers’ folder, we can see the CitiesController class has been created with the code required to perform the CRUD operations on the city entity. The Web API can be accessed on the baseurl/api/cities URL. Different CRUD operations on the Cities Web API can be performed as show in the table below:


We can test the HTTP GET operation in the browser itself.  In the browser XML response of the GET operation for the City entity will be rendered as shown below:

We have successfully created the Web API to perform the CRUD operations on the City entity.


Create a jQuery app using the igGrid

Let us start with creating a blank web application in Visual Studio by choosing the ASP.NET Web Application template from the Web tab. In the installed template, select the Empty template to create the web application. Once project is created successfully, we need to add reference of the Ignite UI library in the project. There are three different ways we can work with Ignite UI reference.

1.       Use the CDN

2.       Download library and add it to the project

3.       In Visual Studio use the NuGet package manager

We are going to use NuGet package manager. To use that, right click on project and from the context menu choose Manage NuGet Packages. Next search for Ignite UI and add the Ignite UI package in the project. Once the package is added, then add an HTML and a JavaScript file in the project.

Once the project is created, start with adding the references of the jQuery and the Ignite UI JS files. In the head section of the HTML, we have added the references of:

·         Ignite UI CSS

·         Bootstrap CSS (optional)

·         Modernizer JS

·         JQuery JS

·         JQuery UI JS

·         Ignite UI Core, dv and lob JS files

·         Demo JS file (we added this JS file in the project. Here we will write the code behind)


<head>

    <title>igGrid CRUD Demo</title>

    <linkhref="Content/Infragistics/css/themes/infragistics/infragistics.theme.css"rel="stylesheet"/>

    <linkhref="Content/Infragistics/css/structure/infragistics.css"rel="stylesheet"/>

    <linkhref="Content/bootstrap.min.css"rel="stylesheet"/>


    <scriptsrc="Scripts/modernizr-2.7.2.js"></script>

    <scriptsrc="Scripts/jquery-2.0.3.js"></script>

    <scriptsrc="Scripts/jquery-ui-1.10.3.js"></script>


    <scriptsrc="Scripts/Infragistics/js/infragistics.core.js"></script>

    <scriptsrc="Scripts/Infragistics/js/infragistics.dv.js"></script>

    <scriptsrc="Scripts/Infragistics/js/infragistics.lob.js"></script>


    <scriptsrc="Scripts/demo.js"></script>


</head>


On the HTML, let us put a button. On clicking the button, changed data will be saved to the server. Also, let’s create a table to create the igGrid. This HTML will have the following markup:


<body>

    <divclass="container">

        <h2>Data Grid Demo</h2>

        <br/>

        <br/>

        <div>

            <inputid="save1"class="btn btn-lg btn-success"type="button"value="Save Changes to server"/>

            <br/>

            <br/>

            <tableid="grid1"></table>

        </div>

    </div>

</body>


In the JavaScript, let us convert the table to the igGrid. Essentially in the igGrid, we have to set the following properties:

·         dataSource property : set to the GET URL of the Web API

·         primaryKey : set to the primary key column of the City entity which is Id

·         autoGeneratedColumsn : false

·         height and width of the grid

·         columns: give the columns a name with the type. In this case we have three columns in which the Id is integer and the other two are strings.

·         restSettings: give the REST URL for the CRUD operations


$(document).ready(function () {


    $("#grid1").igGrid({

        dataSource: "http://localhost:36931/api/cities",

        primaryKey: "Id",

        restSettings: {

            update: {

                url: "http://localhost:36931/api/cities"

            },

            remove: {

                url: "http://localhost:36931/api/cities",

                batch: false

            },

            create: {

                url: "http://localhost:36931/api/cities",

                batch: false

            }

        },

        autoGenerateColumns: false,

        height: "200px",

        width: "800px",

        columns: [

                { headerText: "ID", key: "Id", dataType: "number" },

                { headerText: "Name", key: "Name", dataType: "string" },

                { headerText: "Country", key: "Country", dataType: "string" }

        ],

        features: [

                {

                    name: "Updating",

                    editMode: 'cell',

                    columnSettings: [{

                        columnKey: 'Id',

                        readOnly: true

                    }]

                }

        ]

    });


    $("#save1").on("click", function () {

        $("#grid1").igGrid("saveChanges");

    });


});


And that’s it! Now when we run the application we should able to render the data from the Web API in the grid and perform the CRUD operation. The most important part of the above igGrid is the REST settings. In the REST setting we need to provide the Web API URL for the CRUD operations:

restSettings: {

            update: {

                url: "http://localhost:36931/api/cities"

            },

            remove: {

                url: "http://localhost:36931/api/cities",

                batch: false

            },

            create: {

                url: "http://localhost:36931/api/cities",

                batch: false

            }


When we set the URL properties of update, remove, and create, it will make the POST call on the given URL for the create, PUT for the update, and the DELETE for the remove. Let’s run the application and inspect the network call in the browser developer tool.  I added a new ROW to the igGrid and then clicked on the Save to the server button. In the network tab we can notice that for “create”, igGrid is making a POST call with the request payload to create a new record.


While making the WEB API calls, the igGrid is hiding all the complexities - and as a developer we only need to focus on the setting the URL for different CRUD operations and it’s done! This is the power of the igGrid. When finished, the grid should be rendered as shown in the image below:


Conclusion

In this post, we learned how to:

·         create an ASP.NET Web API

·         perform a CRUD operation in the jQuery igGrid

I hope you found the post useful - thanks for reading and happy coding!

The Transition to a Mobile Enterprise: Five Key Considerations

$
0
0

For a long time, a lot of companies have resisted the move to the mobile enterprise. While more forward thinking CTOs and CIOs have been pushing for change, fears and misconceptions about data loss have paralyzed decision makers. Nonetheless, wherever your company sits along the Technology Adoption Life Cycle, it’s becoming increasingly clear that the mobile workplace has very much arrived and is here to stay.

Gartner have predicted an ever increasing percentage of firms will expect employees to use their own mobile devices, and Forrester research suggests mobile is essential for reaching today’s customers. The case for turning your company into a mobile enterprise is clear, and the organizations which resist change will face greater risks than those who take the plunge:

  • If they can, employees will find ways of using mobile anyway, meaning you have to deal with the threat of Shadow IT.
  • If data is only accessible from company desktops or when sent via email, you’ll miss out on an enormous range of sales and marketing opportunities.
  • Customers, colleagues and partners are likely to view your working patterns as outdated and unresponsive.
  • You’re likely to have less engaged workers, lower productivity and slower communications than your competitors

Mobile can and should work in any industry. You may imagine it only being important in a corporate environment, but anyone from factory workers to delivery drivers and store clerks can experience enormous benefits from mobile working too. So, how can your organization prepare for the transition to mobile?

1. The right tools for the job

Different companies will naturally have different needs for their mobile workforce. It may seem like an obvious consideration, but ensuring the device and operating system you choose is compatible with existing communication and collaboration platforms is crucial. Today’s major mobile and tablet suppliers run on Android, iOS and Windows and applications from most enterprise IT providers function across these different systems. Nonetheless, not every app your employees use will be available on every OS, so you need to be sure the devices you invest in can do everything you require.

Secondly, don’t get tempted by the ‘bells and whistles’ of the latest hardware. It’s essential to have a well-defined strategy, defining what you need and why. You can make huge savings with less advanced devices which are still perfectly capable of doing everything your people need to do. The key is planning and preparation - research your users and research the market before making any major decisions.

2. Safety first

It’s always wise to take precautions. Mobile will mean your colleagues are able to access company data from anywhere with an internet connection, so you don’t want their devices getting into the wrong hands. Helping organizations protect themselves are a range of Mobile Application Management (MAM) and Mobile Device Management (MDM) providers such as MobileIron, Citrix’s XenMobile and Oracle’s OMSS (Bitzer Mobile).

These solutions allow you to carry out remote data wipe, ensure security with device sign on and allow you to control and update the use of company mobile applications on staff devices. If, for instance all employees need a bug fix on a company device, an MAM should allow you to do this remotely across your network, saving you a lot of time.

3. Apps that really fit with your users’ needs

Technology should fit around your end users’ working lives. Ensuring that the apps they use to connect to company systems give them a native experience on any device, facilitate collaboration and give them a smooth experience is absolutely essential. Whether your company uses Office 365 or SharePoint, interfaces which feel familiar, such as Infragistics’ SharePlus, are crucial. 

4. Training and support

Having invested significant resources in deploying a mobile approach across your enterprise, you’ll want your users to actually get the most out of the platform. So many companies just expect user adoption to ‘happen’, yet a lack of training is one of the major reasons that IT projects fail. Provide your colleagues with concrete examples of how mobile can make their lives easier, give them real life demonstrations and boost enthusiasm for the new approach and you’ll see enormous benefits.

5. Be realistic

Yes, mobile is here, but for most businesses this doesn’t mean the end of the desktop or laptop. If your people do design, you’re still going to need powerful computers for Photoshop. Your BI professionals cannot analyze huge amounts of data from a pocket sized screen. Mobile will be another string to your bow, with serious potential for your business, but in most cases it will only add to and extend what you’ve already got.

Mobile first

We’re using mobile more than ever in our personal and professional lives. It changes the way we work, giving employees more control and flexibility when it comes to delivering results. So, will you be a mobile leader or a mobile latecomer?

Did you know that you can deploy Infragistics' Enterprise Mobility Suite, including SharePlus, an industry-leading native mobile SharePoint solution, and ReportPlus, a mobile BI dashboard app, within your MDM platform? Sign up for a SharePlus Enterprise demo today.

SharePlus - Your Mobile SharePoint Solution

Aspects of Datasets - Part 2

$
0
0

This is the second (and final) article looking at key aspects of datasets. Having previously covered relevance, accuracy, and precision, here we will consider consistency, completeness and size.

Consistency

On the 23rd of September 1999, NASA's Mars Climate Orbiter entered the Martian atmosphere and burned up. This $125 million dollar mistake was down to inconsistent use of units between two different pieces of software controlling the satellite.

The Mars Climate Orbiter is not the only example of confusion over use of units being costly (the "Gimli Glider" is another) but it's probably the most expensive. Because of this it has become a textbook example for illustrating the importance of understanding your units of measurement and knowing how to use them correctly. Needless to say, consistency in the use of units and the clear recording of which units are used for later reference should be considered a key feature of a useful dataset.

Consistency is also important with the recording of values too. Painstakingly measuring and recording 99 values to five decimal places could be a massive waste of time if the hundredth value has been rounded to the nearest whole number.

Another consideration is whether the same basic procedure was used for every record or if things were changed part-way through. For demographic data it's important to know whether data from different countries or administrative bodies was recorded at around the same time or years apart (e.g. if you are comparing data from two censuses) and whether those values are really comparable (e.g. how does each country define who is a permanent and who is a temporary resident?).

Completeness

Closely related to consistency is completeness. Ideally you, or someone else, have collected every data point you planned to collect. But this target can be difficult to live up to in practice. Clearly, the first task is to determine whether all data was collected. This may or may not be a trivial task. In the event that some data is missing then the next task is to determine what to do about it. It may be that a few missing values is not a major problem or it may be disastrous.

Assuming you carry on with incomplete data, you need consider possible sources of bias. A census still tells us useful information even if it doesn't truly record every member of the population. But the characteristics of those missing may not match the characteristics of those present. And, if your data collection involved measuring the depth of a river and the measuring equipment was washed away when the river flooded, you can't just interpolate (as below) results from the measurement before the river flooded to the one afterwards when you've replaced your equipment and the river is back flowing normally.

Methods for dealing with data that isn't "missing at random" can be complex. If you're using someone else's dataset and there are only a few missing values it may be possible to do some fieldwork of your own to fill in the gaps. The result is likely an improvement in terms of completeness but a detriment to consistency.

Finally, one has to worry about sample size. Even if the sample as a whole is not majorly affected by a few missing values, smaller subsamples you were keen to analyze may be. In short, not all missing data points are necessarily of equal concern.

Size

Small datasets have very limited statistical power. We run the risk of trying to draw conclusions we just don't have enough data to support. And even if we understand the limitations of what we can really say from our little data, there's no guarantee that people outside the data team will. Nevertheless, with strict time or budgetary constraints (they often go hand-in-hand), that may be all you get.

Recent years have seen the rise in popularity of Big Data. Or at least we've seen the rise in popularity of the phrase "Big Data". Sometimes a Big Dataset is the only option. Still, while proponents will tell you of the virtues, critics say the term Big Data isn't well-defined or is just a marketing gimmick. And with so much data to play with, spurious correlations can become inevitable if due care and attention aren't paid.

My foremost concern with the buzz we've seen in recent years around Big Data is that it might encourage us to come at things from the wrong angle: rather than collecting as much data as is necessary, we end up collecting as much data as possible. There's no guarantee that piling up the data will pile up the insights (visualization can be a bit tricky too), but you may need to worry more about storage, protection and privacy.

As I've hinted at previously, I don't think we should be concerned whether we have "Big Data" but whether we have Big Enough Data.

The Magic is in the Details: The Beauty of Well Designed Micro-interactions and the Horror of Badly Designed Ones

$
0
0


What are microinteractions? Microinteractions are the tiny details of a process that create the flow from beginning to completion. Dan Saffler defines Microinteractions as single moments within a use case.  They are discreet touch points that support over all user experience.


Why do you care? Microinteractions appear in the digital world as well as in the physical. They can be the make or break moments that become the difference between loving an experience and having it drive you to drink. An annoying or frustrating microinteraction that keeps you from completing your intended task can sour your entire view of a brand, leaving you with the impression that they do not care enough about you to make their app efficient and easy. I have set out to notice these microinteractions in my day to day life both real and digital.


Common examples of well designed microinteractions are things that improve your life without you even noticing. Digitally they are things like, autocorrect, Google Instant (predictive search) drag to refresh in your mobile Facebook feed, and that little ellipsis that can cause so much anxiety, yet informs you that the person on the other end of your iMessage is typing something. 


There are plenty of common wonderful microinteractions in the physical world too. For instance when the automatic paper towel dispenser in the bathroom at the airport spits out the appropriate amount of stiff towel to dry your hands the moment you wave your palm in front of it. Another example is a when your coffee maker is so smart that it just knows that you are impatient and have removed the pot mid-brew and stops the drip while you fill your eager mug.


The flip side of these fantastic little experience bits is those that are either not well designed, or don’t function as expected. Digital examples are out there causing endless heartache, distrust, and disappointment.


One example of that is the less than descriptive feedback that impedes the user from completing their intended task. For instance, you go to fill out a form to receive a picture per day from your favorite funny cat site. You exhaustively fill in all of the rows of desired information that is needed to determine the cats that will suit your fancy. As soon as you finally click ‘submit’, you are slapped in the face with an error message that simply says, ‘* information is missing, please correct and resubmit’. How frustrating that you are not informed which field to modify and you must scroll up and down to figure it out yourself.


Another example is when you have a weird pain in your leg and are trying to google your symptoms only so that you can be convinced that you are dying when your Mom texts. The text message drops an alert right in the spot where you were typing and disrupts your (very time sensitive) self diagnosis. This causes you to have to swipe upward to dismiss, in order to complete your task. Ugh. Mom.


Or how about in the physical world when the door handle is facing is situated wrong and you always pull it rather than push?


As I mentioned earlier, I am trying to notice these things in my everyday life. I have noticed a couple of examples of microinteractions that have made things easier for me. One is Apple maps remembering my common addresses so that I can simply bark the first few words of the address that I’d like to find at Siri to get her to pull up the driving directions, rather than saying the full address.


Another is in Gmail. I love Gmail. I have noticed that if I go to send an email, and forget the attachment, it tries it’s best to save me from humiliation by detecting that I have written about an attachment, but not attached anything and alerting me of such. Good lookin’ out, Gmail!


One more microinteraction that always makes me smile is the google chrome “Unable to connect to the internet” alert. Get it? The T-rex can’t reach the internet. I’d bet he can’t make a bed either! Bonus: if you see this message, you can hit the space bar (tap Rex on mobile) and play a little game.


I also walked around my house looking for some day to day items that have microinteractions that make me adore them. One that I found is my electric toothbrush. With a simple extra click of the brush’s single button, it gives me a whitening round once the regular brush cycle is done. Who wouldn’t want that? Another example is in my car. It makes me feel like royalty every time that it rains even a drop and my windshield wipers come on by themselves. It’s as if they are saying, “oh, let me get that for you right away, Ms. Spengel.” and I appreciate it.


It is interesting to think about how these tiny bits of each of our experiences impact our emotions so much. As designers, we have the responsibility to consider each microinteraction, no matter how insignificant it seems.  At the end of the day, something very simple can make a product stand out as ground breaking, or just plain broken. We owe our users a delightful experience.


What are some of the great microinteractions that you have noticed? How about some terrible ones?


Getting a Card's info from Trello (1 of 3)

$
0
0

One of my absolute favorite all time tools is Trello, which is essentially a web application that digitizes the kanban board.  As a Trello user, you have one or more boards, and each board can have one or more columns.  In each column, there are cards.  And, like a live kanban board, you can move the cards around between columns.


Trello is good enough to expose a RESTful API so that I can interact easily with it.  I'm not going to go into a lot of detail on the particulars of the REST style of architecture here, as that's not my main purpose.  But I will offer the useful way of thinking about REST that it's an idea of pairing identified resources with actions -- specifically, HTTP actions.  Or, more simply, it's the idea of pairing nouns and verbs.  And so, figuring out who the members of the Beatles were might involve making a GET request to http://somesite/music/beatles while adding myself to the Beatles might mean issuing a PUT request to http://somesite/music/beatles with a JSON payload containing my name.  Pretty awesome, huh?  I've always wanted to be a Beatle.


Alright, so let's use this REST API from Trello to get a card out.  Trello offers a "getting started" tutorial, and that got the job done for me, but I think it could be explained more simply.  They're aiming to get you started writing applications that interoperate in rich ways with their web application, but I'm just interested, for now, in getting back "toothbrush."


To understand what I mean, take a look at the screenshot below from one of my Trello boards, "Packing."  I use this board when preparing for trips.  I populate the "pack" column with stuff to put in my suitcase, "non-suitcase" with stuff like my laptop and Kindle, and "To Do" with things like "set the thermostat" or "water the plants."  What I want to do here is thus dead simple.  I want to get ahold of that toothbrush card via their API.  That's it.

To do this, you need to be logged in to Trello and, obviously, you're not going to have my toothbrush card, but you can create your own board and card to follow along.  Do that now, if you like.


Once you've identified a card for which to do this, you're going to need three things: the id of the card, an "application key," and a "token."  What you're not going to need is to open Visual Studio or any other IDE, nor will you need to figure out some kind of REST client to build your request.  You'll do just fine with your browser, as-is.  We'll get to the REST clients and IDEs in future posts.


What was initially confusing when you're reading their "getting started" page is why you need a key and a token.  Well, the key is for you as a Trello developer, whereas the token is your way of authorizing calls to your non-public boards (and most boards aren't public).  To make it easier to understand, I could use my developer key to query Trello's public development board and I could also use it to access Ringo Starr's private boards if Ringo Starr issued me a token allowing this.  So when it comes to querying my own board, I need a developer key, and I also need to grant myself permission with a token.


Make sense?  Good.


Now, to get down to business.  Navigate to the trello app-key page while logged in and you'll be granted your key at the top.  That's the easy part.  To grant yourself a token, you're going to need to work.  Scroll down to the bottom and click on the link that says "Click here to request a token to be used in the example." 

Once you click that, you'll get a pop-up requesting permission to grant the application access to use your account.  Hopefully this drives home the idea of a token.  In general, if you want anything to be able to interact with your Trello account, you have to give it permission via this token.  Once you've done that for your own account, it's time to rock and roll.  Now all you need is the ID of the card that you've created, which you can get just by clicking on the card through the application, like so.

With that id in hand, type the following into your URL bar making appropriate substitutions for the placeholders that are colored orange:


https://api.trello.com/1/cards/cardId/?key=YourKeyId&token=YourTokenId


You should see a bunch of JSON in your browser, outlining the attributes of this card. 

And that's it.  Without code, IDE or tools beyond the browser, you've successfully used Trello's API.  Stay tuned for future posts, where we'll get into doing some stuff with it that's actually interesting.

Getting Lost in Enterprise BI Data

$
0
0

Most modern organizations use a wide variety of applications to do their day-to-day business. For example, SharePoint is used for collaboration and storing documents, CRM systems are in place to manage customer relations, and databases store all relational data.

Every system used will have its own data source and User Interface to analyze it. While this works perfectly well if you only run a couple of applications, anything more will leave you feeling lost without a clear overview of where all your data is and how different sources relate to one another.

There is no all-in-one application for the enterprise

At present, there is simply no single application available that meets all the requirements of an enterprise. Some of them do a very good job in eliminating the need for multiple different apps, yet new tools are constantly emerging which offer opportunities for improving productivity and enhancing efficiency. Some of the most common requirements for enterprise productivity apps include:

  • File storage: Every company produces documents and artifacts. Fileshares can be leveraged for basic functionality - Dropbox or Google Drive may be used to make sharing externally easier, but most organizations use an enterprise product like Microsoft SharePoint. SharePoint makes collaboration much easier with features like metadata tagging, search, co-authoring and retention policies to name a few.
  • CRM: Almost every company makes money by selling services and products to customers. CRM systems have been developed to store all data about customers, such as contact details, possible leads, communication, projects and so on. Microsoft CRM is a very popular CRM system, but Salesforce is also widely used in organizations.
  • Databases: Other applications may be in use to fulfil other requirements, and almost any application has a database to store data. Users in the organization may also maintain their own personal database, for example by using Microsoft Access. Any database in the organization may contain invaluable information.
  • Web analytics tools: Google Analytics may be installed on the public facing web site to analyse its popularity and usage, while a tool like Flurry Analytics is aimed at mobile apps
  • Excel: Every business analyst, power user, or manager most likely uses Microsoft Excel to visualize data. It is still one of the most common data management tools and continues to power many companies’ calculations. For example, financial reports, project status reports, customer information are often held in Excel spreadsheets.

A lot of data silos

Every applications has its own data store. This becomes an issue when many applications are in use at the same time, and some functionality may be repeated between them. For example, a sales report may be created in Excel, and then the queries are copied to Salesforce to generate the same report there. Similarly, a report that analyses how many people buy a product on a website is created in Google Analytics, and then copied to a Microsoft CRM for further analysis.

The key problem here is that all data is stored in different silos, and there is not one overview that combines data and reports stored in all of these applications. This could be solved by integrating different systems. For example, SharePoint allows users to embed Excel Worksheets, meaning there is no need to use Excel anymore - SharePoint can be used instead.

However, the limit of this approach is that it requires a case-by-case implementation which takes up time, resources and a lot of configuration. A much easier alternative is to use a tool like ReportPlus. Available on iOS and Android, ReportPlus is particularly useful for enterprises with a wide variety of data sources, and enables them to combine all of these into a single view. Almost every application mentioned in this post can be imported without any developer knowledge.

ReportPlus stands out because it combines all of the valuable data in an organization - regardless of the application it was built in - and places it on one dashboard. This makes it very easy to create stunning visualizations that will make any manager or executive happy.

Configuring ReportPlus, importing data sources and creating dashboards can be done quickly and easily. The platform allows you to share all of this invaluable information via different channels, including Dropbox, SharePoint, or Google Drive. Furthermore, ReportPlus is invaluable as a mobile experience. With apps available for iOS and Android mobile devices, it allows managers on the move to quickly gain insights on the latest information from their organization and take actions accordingly.

Make use of all your different data sources

Many organisations struggle with the huge list of applications they use and a common problem they face is around building reports from data held in different data silos. ReportPlus makes it simple to combine different data sources from applications as diverse as Excel, SharePoint, Oracle DB, SQL or Google Analytics and lets users gain the smartest insights.


Developer News - What's IN with the Infragistics Community? (7/27-8/2)

$
0
0

This week is chock full of graphics! Whether you're interested in learning a new programming language, fixing some responsive design issues or checking out a tiny slip-up from Microsoft, Developer News has got an awesome visual for you!!

5. What Programming Language Should You Learn? (BoingBoing)

4. 10 Responsive Design Problems and Fixes (UX Magazine)

3. This Graphic Helps You Pick Your First Programming Language (Life Hacker)

2. Microsoft Lets Slip an Image of the Upcoming Messaging App for Windows 10 (Windows Central)

1. C# - Singleton Patters vs. Static Classes (DZone)

Getting All Cards with Dates from a Board (2 of 3)

$
0
0

In the last post of this series, I walked you through how to get a JSON dump of a Trello card with nothing more than your browser, a developer key, and a token for access to your private boards and cards.  In this post, we'll get a little more sophisticated with what comes out of Trello.


The first thing to realize is that baking the token and the key into each request is an untenable situation.  In whatever solution you wind up implementing to hit this API, you clearly won't do that.  So, let's take a look at one way to avoid this by hitting the API through a client javascript library that Trello itself furnishes (non minified version can be found here).  Don't worry at all if you're not proficient with javascript (I'm only passingly familiar, myself) -- the code itself comes pre-supplied, and we're not going to alter it much.


Let's first take a look at the packing board from last time. 

You'll note that, in addition to bringing my toothbrush, I've now added a series of items that I need to do before leaving for my hypothetical trip, which starts the afternoon of August 17th.  On the day of departure, I need to empty the trash and turn down the thermostat.  Ahead of time, I need to make sure to renew my passport, and, finally, I have to stop my mail at some point. This last task is not especially date sensitive -- I can do it whenever.  I've reflected this by adding dates to the cards in Trello, as appropriate.  To do this, select the card in question and press the "d" key to take advantage of the keyboard shortcut.  You can then use the date-picker or, if you want, remove a date from a card.


With that in place, let's roll up our sleeves and look at some code!  Now, you're probably wondering how we'll go about issuing these requests: text editor, IDE, something like Fiddler?  Well, no, as it turns out.  Again, you just need your browser, though this is going to be a bit more sophisticated.  As it turns out, Trello supplies a pre-loaded JSFiddle for us to play with.  Click that link, and here's what you'll see:

Cool, huh?  Now, if you click the link, you'll be prompted as to whether or not you want to let "an unknown application" use your Trello account.  If you're not logged in to Trello, you'll see this message:

If you are logged in, you'll see a similar one, but with "Allow" instead of "Log In."  In either case, click the green button and enter your Trello credentials if you're not already logged in.  What you've done here is generate a token, but Trello's client library is handling all of the annoying bits for you.  You should now see a dump of every Trello card you own.  While that's interesting, it's not especially helpful at the moment.


What would be helpful is to have some way to see only which items for the packing boards are time sensitive.  Let's go from this sprawling list to a very focused one with interesting information.  Look for the line in the javascript pane that reads


Trello.get("members/me/cards", function(cards) {


What's happening is that we're issuing a GET request to the members resource and telling it that the thing we want to get is all of the cards for the user that corresponds to the shorthand "me" (which it understands on the basis of the token).  That's a handy thing to file away, but right now what we want to do is see what cards are on the packing board.  That's a good interim goal before narrowing down further. To do that, change the line to

Trello.get("boards/boardId/cards", function(cards) {


where boardId is your board's ID.  You can obtain this by navigating to your board in the browser and, simply copying it from the URL.  Here's the id for my packing board:

Better!  We're only seeing cards from the packing board.  But remember that we're only interested in the ones that have dates attached to them, and this is still showing us everything.  Well, no problem there.  Let's make one more change.  And, while we're at it, let's make the output actually tell us when this needs to happen.


First, we'll need to make sure we're actually seeing the date on the card, which is known as the due date.  Change the line


.text(card.name)


to


.text(card.name + ", due on " + card.due)


That gives you this output, but it's not quite what we want:

To fix that, further modify the line that you just changed to be


.text(card.due === null ? "" : card.name + ", due on " + card.due)


With that change you'll see only the cards that have dates attached.  The javascript and formatting of the date may not be especially pretty, but you have something that's starting to look a bit useful -- you can use the Trello API to search a board to show you only cards with due dates.


Next time, I'll show you how to expand on this and start building out a useful application.

Want to build your desktop, mobile or web applications with high-performance controls? Download Ultimate Free trial now and see what it can do for you!

Exploring App Domains

$
0
0


1. Introduction

People working in the IT industry are often faced with the problem of isolation at all levels of IT systems architecture. For example, hardware systems are often isolated to not be destroyed in accidents together, servers are separated to minimize the effects of breaking-in, and operating system processes are separated for applications security. But in addition to those things, the .NET Framework provides its own unit of isolation – the application domain. 

2. Definition

Application domains are usually created by runtime hosts after bootstrapping the common language runtime. Application domains provide a user code isolation layer that is responsible for security, reliability and versioning. They are also responsible for loading and unloading assemblies.

Figure 1 - AppDomain bootstrapping sequence.

Application domains provide a lot of benefits:

·         A single process can wrap and isolate multiple applications.

·         A fault in one application cannot affect other applications.

·         One application can be completely unloaded without affecting the others.

·         Code executing in one application cannot access the code or resources from other applications.

·         User code permissions can be controlled by the application domain that hosts this code.

·         The application domain provides configuration settings that can determine policies, location of remote assemblies and information where to locate the assemblies that should be loaded in.

3. Communication

One of the greatest advantages of application domains is the isolation that prevents accessing the code or resources from other domains. It is possible to implement a communication between application domains, where objects can be passed between domains by proxy or by copying.

3.1. Communication by proxy

One of the methods used for communication between application domains is to use a proxy object. The proxy object must derive from MarshalByRefObject. The figure below presents a source of console application with a proxy class named MyProxy and the standard Main() method. MyProxy class consists of methods for managing messages and getting the current domain name.

namespace AppDomainProxyExample

{

    using System;

    using System.Collections.Generic;


    public class MyProxy : MarshalByRefObject

    {

        private List<string> messages = new List<string>();


        public void AddMessage(string message)

        {

            this.messages.Add(message);

        }


        public void PrintMessages()

        {

            foreach (var loopMessage in this.messages)

            {

                Console.WriteLine(loopMessage);

            }

        }


        public string GetDomainName()

        {

            return AppDomain.CurrentDomain.FriendlyName;

        }

    }


    public static class Program

    {

        static void Main()

        {

            var childDomain = AppDomain.CreateDomain("ChildDomain");


            var proxy = (MyProxy)childDomain.CreateInstanceAndUnwrap(

                typeof(MyProxy).Assembly.FullName,

                typeof(MyProxy).FullName);


            proxy.AddMessage(AppDomain.CurrentDomain.FriendlyName);

            proxy.AddMessage(proxy.GetDomainName());


            proxy.PrintMessages();

        }

    }

}


Figure 2– AppDomainProxyExample


When AppDomainProxy.exe executable starts, the runtime is started automatically by mscoree.dll. Th­en the default AppDomain is created and the Main() method execution begins. The first line of the Main() method creates a new application domain called ChildDomain. The child domain is used to create and unwrap an instance of MyProxy class. Then two strings are added to the messages collection. The first string is name of default domain and the second string is a current domain name returned from proxy. In the figure below, the proxy object exists in the child domain so it will return the different domain name.

Figure 3 - AppDomainProxyExample.exe execution result.


3.2. Communication by serialization

The second method of communication between application domains is being realized by objects serialization. The figure below presents the example of a console application that shows how to pass objects between application domains. The instance of class named MyObject will be passed from one domain to the other. The MyObject class consists of the Message property and the overridden ToString() method that returns content of Message and hash code. That class was also marked with SerializableAttribute. This attribute is necessary for serialization.

namespace AppDomainSerializationExample

{

    #region Usings

    using System;

    #endregion


    [Serializable]

    public class MyObject

    {

        public string Message { get; set; }


        public override string ToString()

        {

            return this.Message + " " + this.GetHashCode().ToString();

        }

    }


    public static class Program

    {

        static void Main()

        {

            var childDomain = AppDomain.CreateDomain("childDomain");


            var myObject1 = new MyObject { Message = "Hello World!"};

            Console.WriteLine(myObject1);


            childDomain.SetData("MyObject", myObject1);           

            childDomain.DoCallBack(() =>

            {

                var myObject2 = (MyObject)AppDomain.CurrentDomain.GetData("MyObject");

                Console.WriteLine(myObject2);

            });

        }

    }

}


Figure 4 - AppDomainSerializationExample


The first line of Main() method works the same as it did in the previous example. Then the instance of MyObject is created and passed to the child domain by calling SetData() method. The first parameter of SetData() method is a key, and the second is an object that will be copied. Then DoCallback() method is called. That method invokes a CrossAppDomainDelegate in child domain. The delegate passed to DoCallback() is executed in the child domain. The callback picks the copy of the object passed to the domain by using the GetData() method.


Figure 5 - AppDomainSerializationExample.exe execution result.


The figure above shows the result of the Main() method execution. The messages are the same, but the hash code is not, because the object passed to the child domain was serialized.

4. Summary

Enterprise applications often provide some kind of open modules system. What about security? Imagine a situation when each of loaded modules can modify resources of host application. In optimistic case it may result in application instability, but in the worst case it may crash entire application with other modules or cause a lot of security abuses. How this problem should be solved? For example each module can be loaded into separate application domain and use only directly shared resources. Unstable module wrapped in application domain can be easily handled and unloaded.

5. References

https://msdn.microsoft.com/en-us/library/2bh4z9hs(v=vs.110).aspx


Developer Humor: Party Query

$
0
0

Summertime should be fun and relaxing, right? Right! So I'm here with an installment of Developer Humor to brighten up your August day.

Share With The Code Below!

<a href="http://www.infragistics.com/products/jquery"><img src=" http://www.infragistics.com/community/cfs-filesystemfile.ashx/__key/CommunityServer.Blogs.Components.WeblogFiles/d-coding/8270.Tech-toon-_2D00_-2015-_2D00_-09.jpg " height="594" width="792" /> </a><br /><br /><br />Party Query by Infragistics <a href="http://www.infragistics.com/products/wpf">jQuery Controls</a>

Getting Started with the ASP.NET Web API - Webinar Recap

$
0
0

On July 24th we hosted a webinar on “Getting started with ASP.NET Web API” for the Indian region and we’d like to share the presentation and recorded webinar with you now! In the webinar, we explored:

  • An intro to the Web API
  • How to write your First Web API using Scaffolding
  • Consuming Web API in jQuery and IGGrid
  • Enabling CORS
  • Code First and Repository Pattern in Web API

You can find the recording of the presentation here:

[youtube] width="560" height="315" src="http://www.youtube.com/embed/FHjB1qEoDE8" [/youtube]

And you can also access the presentation slides here.

Some of the questions from the webinar are below. For many of the questions we will write detailed blog posts here on the Infragistics blog, but for now:

How do you create role based authorization in Web API?

We can do authentication and authorization in Web API using the OWIN server and ASP.NET Identity 2.0. To enable it while creating the Web API project you can choose the authentication as shown in the image below:


Does the Web API only work for mobile apps?

No! You can use Web API across clients like web applications, desktop applications and mobile applications.

What do we mean by OData Support in Web API?

In the ASP.NET Web API, you can enable the support of OData by returning the IQueryable. Using the OData fetch query can be applied in the query string. By default ASP.NET Web API has support of OData.

How can we change the content negotiation format?

The client can request for a specific format in the Accept Header as seen here:

Once again, thank you so much for your interest in our webinars – and we look forward to seeing you at a future webinar!

12 tips to increase the performance of ASP.NET application drastically – Part 1

$
0
0


Building web application and hosting it on a web server is insanely easy with ASP.NET and IIS. But there are lots of opportunities and hidden configurations which can be tweaked that can make it high performance web application. In this series post, we are going to discuss some of the most unused or ignored tricks which can be easily applied to any web application.

1-      Kernel mode cache - It is one of the primary tools widely used for writing making web application faster. But most of the times, we don’t use it optimally and just leave some major benefits.  As each asp.net request goes through various stages, we can implement caching at various level as below


We can see that request is first received by http.sys so if it is cached at kernel level, then we can save most of the time spent on server as http.sys is a http listener which sits in OS kernel and listens the request directly from TCP layer. We can save all the time spent IIS/ASP.NET pipeline, page lifecycle, our custom code, time taken in DB etc. Let’s see how we can implement it.

a)      Go to IIS and select the web site.

b)      Click on Output Cache icon on right under IIS section

c)       In right panel, under Actions click on Add. Following dialog will open


Here in red encircled area, we need to define that the file extensions which we want to cache at kernel. Second encircled area, we need to select the checkbox. Third encircled area show that there are three options is provided to invalidate the cache. Based on our requirement we can configure it.

Note – there are some limitation over caching in kernel level. As all the features of IIS are implemented at User level so we will not able leverage any of those. Refer this msdn article for complete list where kernel caching cannot be implemented.


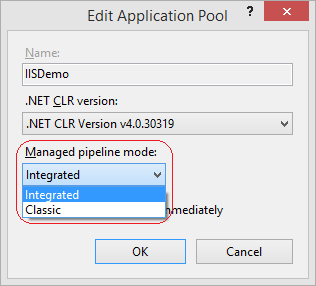
2-      Pipeline mode (Available on IIS 7+)– At application pool level, there are two pipeline modes available: classic and integrated. Classic is available to support the applications that were migrated from IIS6. So first let’s understand these modes. IIS provides many features which are implemented as modules in IIS and in similar way many feature are implemented as HTTP Module which are part of ASP.NET Pipeline. In case of classic mode, each request goes through first IIS pipeline and then ASP.NET pipeline before getting served. There are many features which are part of both the pipelines like Authentication etc. In case of Integrated mode, these two pipelines are merged into one and all the module (IIS and ASP.NET) are invoked from the single event as they come along which reduces the redundancy and very helpful in performance of an application.

To set/update the pipeline mode, select the desired application pool and right click properties


Here as encircled in the above pic, we can set the pipeline mode.

Note – Don’t go for blindly changing it, if your application migrated from IIS6 then there could be some dependency over it. After changing thoroughly test it before moving ahead.

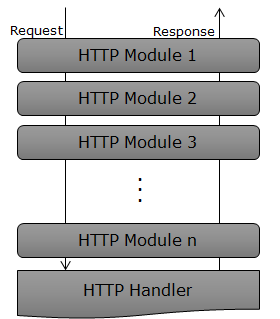
3- Remove unused Modules– Each request has go through ASP.NET Pipeline which contains many http modules and at the end one http handler, which serves the request as below

We can see here the request goes through the each modules, processed by the handler then again come though again via the same modules. Let’s see how many modules are by default enabled in an ASP.NET Application. I have added the below code to get all the modules

HttpApplication httpApps = HttpContext.ApplicationInstance;


//Get list of active modules

HttpModuleCollection httpModuleCollections = httpApps.Modules;

ViewBag.ModulesCount = httpModuleCollections.Count;


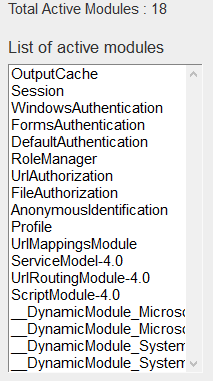
And this collection can be bound to any control and it displays as

It is showing eighteen modules which some of them we may not be using but each request gets has to though these all modules. So we can remove these modules from the pipeline. To remove a module, we just require to add configuration in web.config as

  <system.webServer>

    <modules>

      <removename="FormsAuthentication" />

      <removename="DefaultAuthentication" />

      <removename="OutputCache" />

      <removename="AnonymousIdentification" />

      <removename="RoleManager" />

    </modules>

  </system.webServer>

Here we list down the modules that we want to remove with remove tag. Now as we added here remove five modules, next time when we will check the active modules, it will be thirteen.

Note – For this demo I have used VS 2013, you may get different number when use another version but the key point is that we should remove all the modules which are not required.


4 -  runAllManagedModulesForAllRequests - It is another configuration, one must have seen in web.config or applicationHost.config where it is set globally for all the application on that IIS as

<modulesrunAllManagedModulesForAllRequests="true">

It means all the modules would be running for all the request coming to application but we normally don’t require that because it should run only ASP.NET files, not other files like css, js, jpg, html etc. It means even the request of these resources going through the pipeline which is unnecessary for these files and it just adding extra overheads. But we cannot make simply false at application level. So there could be two ways -

a)      Create a different application just for serving these static resources and set this setting as false in web.config.

b)      Or in same application, put all the static resources in a folder and add a web.config file specific to that folder and make it false.


5         Do not writing anything in the folder c:\inetpub\wwwroot. - There is a file watcher looks into the folder and if there is any changes in this folder, it restarts the corresponding application pool. This is a feature available in IIS, if there is any change in web.config or any file, it restarts the application pool so that your modified application serves the request. Now say you write the application log in some text file inside the application folder which makes couple of entries in each request, then application pool would be restarting that many times which would be hazardous for your application. So instead, don’t write or change anything in this folder until it is not part of application binaries.


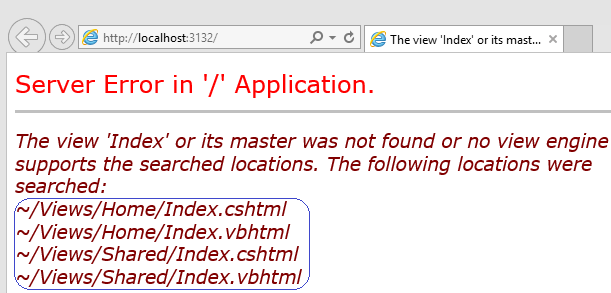
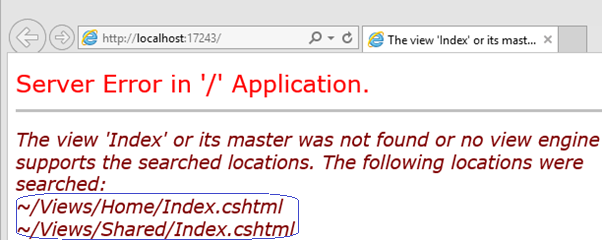
6         Remove extra View Engines– a) As we know View Engines is a part of MVC request life cycle and has a responsibility to find the view and process it. It allows us add our own custom view engines as well. Let’s create a default MVC application and try to return a view which does not exists in the solution. Now when we run this applications this shows the following error.


It shows that it is looking for the razor and aspx files to all the possible locations. But as we know that we are using razor view engine so it should not waste time in looking other aspx files because we already know that it is not going to be part of solution. So we should remove all the extra View Engines.  We need to add following code in Application_Startmethodwhich is available in Global.asax.

            // Removing all the view engines

            ViewEngines.Engines.Clear();


            //Add Razor Engine (which we are using)

     ViewEngines.Engines.Add(newRazorViewEngine());

Now let’s run it again

                 Now it is looking for only razor files

b)      If we carefully see the above screenshot then we see that it is looking for c# and vb files and say in our solutions we have never used vb, so again there is no use of looking for vbhtml files. To fix this we need to write our own custom ViewEngine. So let’s write our Custom RazorViewEngine as

    publicclassMyCustomViewEngine : RazorViewEngine

    {

        public MyCustomViewEngine()

        {

            base.AreaViewLocationFormats = newstring[] { "~/Areas/{2}/Views/{1}/{0}.cshtml", "~/Areas/{2}/Views/Shared/{0}.cshtml"};

            base.AreaMasterLocationFormats = newstring[] { "~/Areas/{2}/Views/{1}/{0}.cshtml", "~/Areas/{2}/Views/Shared/{0}.cshtml" };

            base.AreaPartialViewLocationFormats = newstring[] { "~/Areas/{2}/Views/{1}/{0}.cshtml","~/Areas/{2}/Views/Shared/{0}.cshtml"};

            base.ViewLocationFormats = newstring[] { "~/Views/{1}/{0}.cshtml", "~/Views/Shared/{0}.cshtml" };

            base.MasterLocationFormats = newstring[] { "~/Views/{1}/{0}.cshtml", "~/Views/Shared/{0}.cshtml" };

            base.PartialViewLocationFormats = newstring[] { "~/Views/{1}/{0}.cshtml", "~/Views/Shared/{0}.cshtml" };

            base.FileExtensions = newstring[] { "cshtml" };

        }

    }

Here I have inherited it from RazorViewEngine and if we see the constructor in the then we find that there we have defined all the possible locations where a file can exist which includes possible file extensions as well. Now let’s use this View Engine in Global.asax.

And run the application.

Now it looks for csharp razor files which makes sense and performance friendly.

Conclusion– In this post, we have discussed following six tips which can be easily applied to any ASP.NET application.

1-      Kernel mode Cache

2-      Pipeline mode

3-      Remove unused modules

4-      runAllManagedModulesForAllRequests

5-      Don’t write in wwwroot

6-      Remove unused view engines and language

In next post of the series we will discuss five more tips which will work as a performance booster for the applications.


Cheers

Brij


Creating an ASP.NET Web API using the Entity Framework Code First approach and the Repository pattern

$
0
0

In this article, we will learn how to create an ASP.NET Web API using the Repository pattern and the Entity Framework code first approach. Essentially you’ll learn how to:

1.       Create a core project which will contain entity and the repository interface;

2.       Create an Infrastructure project which will contain database operations code using the Entity Framework code first approach;

3.       Create a Web API to perform CRUD operations on the entity;

4.       Consume the Web API in a jQuery application and render the data in the Ignite UI Chart.

What is a Repository pattern?

Let us first understand why we need a Repository pattern. If you do not follow a Repository pattern and directly use the data then the following problems may arise-

·         Duplicate code

·         Difficulty implementing any data related logic or policies such that caching

·         Difficulty in unit testing the business logic without having the data access layer

·         Tightly coupled business logic and database access logic

By implementing a repository pattern we can avoid the above problems and get the following advantages:

·         Business logic can be unit tested without data access logic

·         Database access code can be reused

·         Database access code is centrally managed so easy to implement any database access policies such that caching

·         Easy to implement domain logics

·         Domain entities or business entities are strongly typed with the annotations.


Now that we’ve listed how great they are, let’s go ahead and start implanting a repository pattern in the ASP.NET Web API.


Create the Core project

In the core project you should keep the entities and the repository interfaces. In this example we are going to work with the City entity. So let us create a class City as shown in the listing below:


using System.ComponentModel.DataAnnotations;


namespace WebApiRepositoryPatternDemo.Core.Entities

{

   publicclassCity

    {

       publicint Id { get; set; }

       [Required]

       publicstring Name { get; set; }

       publicstring Country { get; set; }

       publicint Population01 { get; set; }

       publicint Population05 { get; set; }

       publicint Population10 { get; set; }

       publicint Population15 { get; set; }

    }

}


As you see we are annotating data using the Required attribute which is part of System.ComponentModel.DataAnnotations. We can put annotations on the city entity using either of two approaches:

1.       Using the System.ComponentModel.DataAnnotations

2.       Using the Entity Framework Fluent API

Both approaches have their own advantages. If you consider that restriction on the domain entities is part of the domain, then use data annotations in the core project. However if you consider restrictions are related to database and use the Entity framework as database technology then go for a fluent API.

Next let’s go ahead and create the repository interface. Whatever operation you want to perform on the City entity should be part of the repository interface.  ICityRepository interface can be created as shown in the listing below:


using System.Collections.Generic;

using WebApiRepositoryPatternDemo.Core.Entities;


namespace WebApiRepositoryPatternDemo.Core.Interfaces

{

    publicinterfaceICityRepository

    {

        void Add(City b);

        void Edit(City b);

        void Remove(string Id);

        IEnumerable<City> GetCity();

        City FindById(int Id);

    }

}


Keep in mind that the Core project should never contain any code related to database operations. Hence the following references should not be the part of the core project-

·         Reference to any external library

·         Reference to any database library

·         Reference to any ORM like LINQ to SQL, entity framework etc.

After adding the entity class and the repository interface, the core project should look like the image below:


Create the Infrastructure project

In the infrastructure project, we perform operations which are related to outside the application. For example:

·         Database operations

·         Consuming web services

·         Accessing File systems

To perform the database operation we are going to use the Entity Framework Code First approach. Keep in mind that we have already created the city entity on which CRUD operations are needed to be performed. Essentially to enable CRUD operations, the following classes are required: 

·         DataContext class

·         Repository class implementing Repository interface created in the core project

·         DataBaseInitalizer class

We then need to add the following references in the infrastructure project:

·         A reference of the Entity framework. To add this, right click on the project and click on manage Nuget package and then install Entity framework

·         A reference of the core project


DataContext class

 In the DataContext class:

1.       Create a DbSet property which will create the table for City entity

2.       In the constructor of the DataContext class, pass the connection string name where database would be created

3.       CityDataContext class will inherit the DbContext class

The CityDataContext class can be created as shown in the listing below:


using System.Data.Entity;

using WebApiRepositoryPatternDemo.Core.Entities;


namespace WebApiRepositoryPatternDemo.Infrastructure

{

   publicclassCityDataContext : DbContext

   {

       public CityDataContext() : base("name=cityconnectionstring")

       {


       }

       publicIDbSet<City> Cities { get; set;  }


    }

}


Optionally, you can either pass the connection string or rely on the Entity Framework to create the database. We will set up the connection string in app.config of the infrastructure project. Let us go ahead and set the connection string as shown in the below listing:


  <connectionStrings>

  <addname="cityconnectionstring"connectionString="Data Source=(LocalDb)\v11.0;Initial Catalog=CityPolulation;Integrated Security=True;MultipleActiveResultSets=true"providerName="System.Data.SqlClient"/>

  connectionStrings>


Database initialize class

We need to create a database initialize class to feed the database with some initial value at time of the creation.  To create the Database initialize class, create a class and inherit it from DropCreateDatabaseIfModelChnages. Here we’re setting the value so that if the model changes recreate the database. We can explore the other options of the entity framework also and inherit the database initialize class from the cross ponding class.  In the Seed method we can set the initial value for the Cities table. With a record of three cities, the Database initializer class can be created as shown in the listing below:


using System.Data.Entity;

using WebApiRepositoryPatternDemo.Core.Entities;


namespace WebApiRepositoryPatternDemo.Infrastructure

{

    publicclassCityDbInitalize : DropCreateDatabaseIfModelChanges<CityDataContext>

    {


        protectedoverridevoid Seed(CityDataContext context)

        {

            context.Cities.Add(

                  newCity

                  {

                      Id = 1,

                      Country = "India",

                      Name = "Delhi",

                      Population01 = 20,

                      Population05 = 22,

                      Population10 = 25,

                      Population15 = 30

                  });


            context.Cities.Add(

                 newCity

                 {

                     Id = 2,

                     Country = "India",

                     Name = "Gurgaon",

                     Population01 = 10,

                     Population05 = 18,

                     Population10 = 20,

                     Population15 = 22

                 });


            context.Cities.Add(

                 newCity

                 {

                     Id = 3,

                     Country = "India",

                     Name = "Bangalore",

                     Population01 = 8,

                     Population05 = 20,

                     Population10 = 25,

                     Population15 = 28

                 });


            context.SaveChanges();


                base.Seed(context);


        }

    }

}


Repository class

So far we have created the DataContext and DatabaseInitalize class. We will use the DataContext class in the repository class. The CityRepository class will implement the ICityRepository interface from the core project and perform CRUD operations using the DataContext class. The CityRepository class can be implemented as shown in the listing below:

using System.Collections.Generic;

using System.Linq;

using WebApiRepositoryPatternDemo.Core.Entities;

using WebApiRepositoryPatternDemo.Core.Interfaces;


namespace WebApiRepositoryPatternDemo.Infrastructure.Repository

{

    publicclassCityRepository : ICityRepository

    {

        CityDataContext context = newCityDataContext();

        publicvoid Add(Core.Entities.City b)

        {

            context.Cities.Add(b);

            context.SaveChanges();


        }


        publicvoid Edit(Core.Entities.City b)

        {

            context.Entry(b).State = System.Data.Entity.EntityState.Modified;

        }


        publicvoid Remove(string Id)

        {

            City b = context.Cities.Find(Id);

            context.Cities.Remove(b);

            context.SaveChanges();

        }


        publicIEnumerable<Core.Entities.City> GetCity()

        {

            return context.Cities;

        }


        public Core.Entities.City FindById(int Id)

        {

            var c = (from r in context.Cities where r.Id == Id select r).FirstOrDefault();

            return c;

        }

    }

}


Implementation of the CityRepository class is very simple. You can see that we’re using the usual LINQ to Entity code to perform the CRUD operations. After implementing all the classes, the infrastructure project should look like the image below:


Create the WebAPI project

Now let’s go ahead and create the Web API project. To get started we need to add the following references:

1.       Reference of the core project

2.       Reference of the infrastructure project

3.       Reference of the Entity framework

After adding all the references in the Web API project, copy the connection string (added in the previous step cityconnectionstring) from the APP.Config of the infrastructure project to the web.config of the Web API project.  Next open the Global.asax file and in the Application_Start() method, add the below lines of code to make sure that seed data has been inserted to the database:


            CityDbInitalize db = newCityDbInitalize();

            System.Data.Entity.Database.SetInitializer(db);


At this point, build the Web API project then right click on the Controllers folder and a new controller. Create a new controller with the scaffolding, choosing Web API 2 Controller with actions, using Entity Framework option as shown in the image below:


Next, to add the Controller, select the City class as the Model class and the CityDataContext class as the Data context class.


Once you click on Add, you will find a Web API controller has been created with the name CitiesController in the Controllers folder. At this point when you go ahead and run the Web API, you should able to GET the Cities in the browser as shown in the image below:


Here we have created the Web API using the Entity Framework CodeFirst approach and the Repository pattern.  You can perform CRUD operations by performing POST, GET, PUT, and DELETE operations on the api/cities URL as shown in the image below:


clip_image011


JQuery Client to consume Web API

Now let’s go ahead and display the population of the cities in an igChart. I added references of the IgniteUI JS and CSS files on the HTML as shown in the below listing:


<title>igGrid CRUD Demotitle>

    <linkhref="Content/Infragistics/css/themes/infragistics/infragistics.theme.css"rel="stylesheet"/>

    <linkhref="Content/Infragistics/css/structure/infragistics.css"rel="stylesheet"/>

    <linkhref="Content/bootstrap.min.css"rel="stylesheet"/>


    <scriptsrc="Scripts/modernizr-2.7.2.js">script>

    <scriptsrc="Scripts/jquery-2.0.3.js">script>

    <scriptsrc="Scripts/jquery-ui-1.10.3.js">script>


    <scriptsrc="Scripts/Infragistics/js/infragistics.core.js">script>

    <scriptsrc="Scripts/Infragistics/js/infragistics.dv.js">script>

    <scriptsrc="Scripts/Infragistics/js/infragistics.lob.js">script>


    <scriptsrc="Scripts/demo.js">script>


In the Body element, I added as table as shown in the listing below:


              <table>

                    <tr>

                        <tdid="columnChart"class="chartElement">td>

                        <tdid="columnLegend"style="float: left">td>

                    tr>


                table>


To convert the table to the igChart in the document ready function of jQuery, we need to select the table and convert that to igChart as shown in the listing below:


    $("#columnChart").igDataChart({

        width: "98%",

        height: "350px",

        dataSource: "http://localhost:56649/api/Cities",

        legend: { element: "columnLegend" },

        title: "Cities Population",

        subtitle: "Population of Indian cities",

        axes: [{

            name: "xAxis",

            type: "categoryX",

            label: "Name",

            labelTopMargin: 5

        }, {

            name: "yAxis",

            type: "numericY",

            title: "in Millions",

        }],

        series: [{

            name: "series1",

            title: "2001",

            type: "column",

            isHighlightingEnabled: true,

            isTransitionInEnabled: true,

            xAxis: "xAxis",

            yAxis: "yAxis",

            valueMemberPath: "Population01"

        }, {

            name: "series2",

            title: "2005",

            type: "column",

            isHighlightingEnabled: true,

            isTransitionInEnabled: true,

            xAxis: "xAxis",

            yAxis: "yAxis",

            valueMemberPath: "Population05"

        }, {

            name: "series3",

            title: "2010",

            type: "column",

            isHighlightingEnabled: true,

            isTransitionInEnabled: true,

            xAxis: "xAxis",

            yAxis: "yAxis",

            valueMemberPath: "Population10"

        },

        {

            name: "series4",

            title: "2015",

            type: "column",

            isHighlightingEnabled: true,

            isTransitionInEnabled: true,

            xAxis: "xAxis",

            yAxis: "yAxis",

            valueMemberPath: "Population15"

        }]

    });


Here we are setting the following properties to create the chart:

·         The data source property is set to the API/Cities to fetch all Cities information on the HTTP GET operation

·         The legend of the chart as column legend

·         The height and width of the chart

·         The title and sub title of the chart

·         The XAxis and YAxis of the chart

·         We also created the series by setting the following properties:

o   Name

o   Title

o   Type

o   valueMemberPath – It must be set to the numeric column name of the City entity.


On running the application, you will find that City data from the Web API has been shown rendered in the chart as shown in the image below:


Conclusion

There you have it! In this post we learned how to create ASP.NET Web API using the Repository pattern and Entity Framework code first approach. I hope you find this post useful, and thanks for reading!


Building Data-Bound Apps in Xamarin.Forms

$
0
0

I’m so excited to bring you this special guest post from one of our partners! Please enjoy this special cross-platform app development blog by Xamarin’s very own Nish Anil!


Developers everywhere keep telling us how awesome Infragistics’ Xamarin solution, Xamarin.Forms is!  With Xamarin alone, developers can build native iOS, Android, and Windows apps from one shared C# codebase across platforms, making it fast and easy to ship high quality apps. Then, when using Xamarin.Forms, Xamarin's toolkit for cross-platform UI, lets you create UI views entirely in C# code, or you can take advantage of Extensible Application Markup Language (XAML). XAML is a declarative XML-based markup language from Microsoft used to describe user interfaces.  Since Xamarin.Forms inherently supports data binding, you can take advantage of the MVVM (Model-View-ViewModel) architectural pattern that is widely used in technologies like WPF and Silverlight within the .NET Framework.


With Infragistics controls for Xamarin.Forms, you can build interactive, data-bound, high-performance data visualizations for mobile apps that today's high-demand business users require. Some of the data visualization controls include Pie Charts, Gauges, Bullet Graphs and commonly used data charts with series like Category, Financial, Stacked, etc.


Xamarin.Forms works great for rapid development of line-of-business applications where you have fewer UI customizations and code sharing is your utmost priority. Such enterprise apps generally have straightforward requirements, like having a few forms to capture data, a dashboard to visualize data, and few customizations for user interaction. A dashboard app with charts and forms does not require too many UI customization on every platform. For example, a PieChart is represented as a PieChart, LineChart as a LineChart, etc, regardless of what platform they’re rendered on.


With Xamarin.Forms, MVVM, and Infragistics controls combined, you can build interactive dashboards for iOS, Android, and Windows with maximum code shared across all platforms (up to 99%).  With a little bit of customization, such as choosing right the Color, optimizing Typography, and rendering appropriate Platform specific controls, you can make your apps visually stunning and perfect for the platform.


For this post, I built “WorldData” sample apps in Xamarin.Forms, using Infragistics charts to display per country data, including Demography, Life Expectancy, Health and Disease, Education, etc. 


Data Source


This app uses data from Quandl and has live data fetch using Quandl APIs, as well as from an offline CSV file included as part of the project resources. I did this to show you how you can use both mechanisms to display data in your app.


Get Started


If you're new to Xamarin.Forms, I encourage you to look at the native detailed documentation before you get started.


To get started with Infragistics controls, follow the instructions in their documentation and set up your Xamarin.Forms project accordingly.


Source Code and Setup


The source code of this sample can be found in my Github repo. To compile and run the project successfully, please download and install Infragistics Xamarin.Forms, and add all the Xamarin.Forms related dlls to the libs folder.

Designing Pages in XAML

A page is the topmost visual element that occupies the entire screen and has just a single child. You can choose from five different pages –

     ContentPage

     MasterDetailPage

     NavigationPage

     TabbedPage

     CarouselPage


For this sample, NavigationPage is set to the topmost page that stacks other content pages and handles Navigations between them. All the other pages are of type ContentPage.

Layout


Layouts act as a container for views and other layouts. It contains the logic to set the position and size of child elements in Xamarin.Forms apps. I've used the Grid layoutsystem throughout the pages of this sample. Grid layout in Xamarin.Forms is very similar to the WPF Grid layout system; it incorporates views arranged in rows and columns.

Here's an example of a Grid written in XAML:


  <Grid HorizontalOptions="FillAndExpand"

          Padding="0"

          RowSpacing="0"

          ColumnSpacing="0"

          VerticalOptions="FillAndExpand">

    <Grid.RowDefinitions>

      <RowDefinition Height="300"></RowDefinition>

  <RowDefinition Height="Auto"></RowDefinition>

    </Grid.RowDefinitions>

    <Grid.ColumnDefinitions>

      <ColumnDefinition Width="*"></ColumnDefinition>

    </Grid.ColumnDefinitions>

    <Label Grid.Row="0" Grid.Column="0"></Label>

    </Grid>


In the above code, the Label is placed in the 1st row, 1st Column of the Grid that defines 2 rows and 1 column. To learn more about Grid, I suggest you read the Chapter - 17 Mastering the Grid of Creating Mobile Apps with Xamarin.Forms (Charles Petzold).


HomePage in this sample mainly consists of a PieChart representing the World Population and a searchable ListView containing the list of countries. When a country is clicked, the user navigates to the country specific details.


Adding a Pie Chart


To add an XFPieChart, first add the namespace to the Page:

xmlns:igc="clr-namespace:Infragistics.XF;assembly=InfragisticsXF"


then, place them in the layout


        <ig:XFPieChart x:Name="pieChart"

                       HeightRequest="250"

                       InnerExtent="0"

                       RadiusFactor="0.7"

                       AllowSliceSelection="True"

StartAngle="150"

                       AllowSliceExplosion="True"

                       ItemsSource="{Binding Data}"

                       LabelMemberPath="Label"

                       ValueMemberPath="Level"

                       HorizontalOptions="FillAndExpand"

                       VerticalOptions="FillAndExpand"

                       OthersCategoryThreshold="0"

                       LabelsPosition="OutsideEnd"

                       LeaderLineType="Arc"

                       LeaderLineVisibility="Visible"/>


Notice, the ItemSource set as {Binding Data} - Data is the property of the ViewModel that is set to the BindingContext of the View.


private HomePageViewModel vm;

        public HomePage()

        {

            InitializeComponent();

            BindingContext = vm =  new    HomePageViewModel();

}


Here's the code that loads the data country-wise and sets appropriate properties in the ViewModel.


worldRepository.GetCountries().ContinueWith(list =>

            {

                Countries = list.Result;

                var dataItems = new ObservableCollection<DataItem>();

                foreach (var region in worldRepository.CountriesByRegion)

                {

                    var dataItem = new DataItem {Label = region.Key, Level = region.Value.Sum(x => x.Level.ToDouble())};

                    dataItems.Add(dataItem);

                }


                Data = dataItems;

            });


In the above code, when the Data is set, the Infragistics chart automatically renders them beautifully. Similarly, the ViewModel has an ItemSource property that is used to bind the ListView data, which is also fetched from the CSV file. When the items in the ListView is tapped, the user is navigated to the CountryInfoPage.


Customizing the Chart

By default, the chart sets some automatic colors for the Brushes and Outline. Also, the fonts are chosen automatically. You can always customize the Colors and Typography to meet the theme of your dashboard with few lines of codes; minor tweaks can give your apps a stunning look and feel, making them stand out.


To change the colors of the chart, first add the BrushCollection to the ResourceDictionary


<ContentPage.Resources>

    <ResourceDictionary>

      <igc:BrushCollection x:Key="SliceBrushes">

        <igc:SolidColorBrush Color="#4DB6AC" />

   .....

      </igc:BrushCollection>

      <igc:BrushCollection x:Key="OutlineBrushes">

        <igc:SolidColorBrush Color="#4DB6AC" />

        <igc:SolidColorBrush Color="#4DD0E1" />

  ....

      </igc:BrushCollection>

    </ResourceDictionary>

  </ContentPage.Resources>


And then add them and set them to the Chart properties

<ig:XFPieChart x:Name="pieChart"

                       Brushes="{StaticResource SliceBrushes}"

                       Outlines="{StaticResource OutlineBrushes}"

....


Similarly, you can set the fonts according to the app theme using the FontFamily and FontSize property.


FontFamily="{x:Static local:Theme.FontFamilyMedium}"

                       FontSize="{x:Static local:Theme.FontSizeMicro}"


Connecting to Quandl Backend


CountryInfoPage and CountryDetailsPage for this sample connects to Quandl API for live data. Here’s the method that connects to Quandl API using HttpClient libraries and deserializes the JSON data to a model object using Newtonsoft JSON libraries.


        public async static Task<QuandlData> GetQuandlDataAsync(string authToken, string countryCode, string indicator, string transformation = null, string collapse = null)

        {


            //…


            HttpClient client = new HttpClient();

            var result = await client.GetStringAsync(uri);


            var data = JsonConvert.DeserializeObject<QuandlData>(result);


            return data;

        }


The above data is represented in a Infragistics LineChart in ChartView class.


Customizing for Each Platform


While Xamarin.Forms lets you build apps for iOS, Android, and Windows without writing any platform-specific code, you can make your app stand out in every platform with a few controls customizations. There are multiple ways you can customize your controls: from simple customizations, like Typography, or render a completely different control on every platform.


Simpler Platform tweaks

For simpler platform-specific tweaks, such as Typography, Colors, and layout changes, the Device<T> class helps in detecting and writing platform logic in your shared code. Specifically, with Device.OnPlatform generic method, you can customize simple things like Fonts.


public static string FontFamilyRegular

        {

            get

            {

                return Device.OnPlatform(iOS: "AvenirNext-Regular", Android: "Roboto Light", WinPhone: "Segoe WP Light");

            }

        }


Since the above code is written in the Theme class, you can reference them in XAML like this:


 <Label Text="Countries"  FontFamily="{x:Static local:Theme.FontFamilyRegular}" />


You can also write the OnPlatform completely in XAML resource dictionary and re-use them in your controls. Refer the documentation for details.


Customizing Controls using Custom Renderers


Since Xamarin.Forms renders fully native controls, you can always customize existing renderers, or create a new control in your shared code to write appropriate native renderers in platform-specific code.


For this sample app, I needed a filter control that had various options that, when selected, filtered the data and rendered the chart accordingly. Since, iOS had a UISegmentedControl that best suited my requirement, I had to find something similar for Android and Windows. Luckily, there is a PopupMenu in Android which can be used to mimic the iOS functionality.  So, I wrote a Options Control in my shared code, and wrote appropriate renderers in the platform projects. You can refer my code on GitHub repo for details:

     Options Custom Control

     OptionsRenderer - iOS (Renders UISegmentedControl)

     OptionsRenderer - Android(Renders PopupMenu Control)


Finally, here’s how they look in iOS and Android:


Custom renderers are explained in detail in the developer documentation.


I encourage you to dive into Xamarin.Forms and Infragistics to make your data-heavy apps visually stunning, while retaining fast development speed, native quality, and high performance[1] !


To learn more about Xamarin.Forms:

     Explore Xamarin’s Developer Documentation

     Download your free copy of Charles Petzold’s book, Creating Mobile Apps with Xamarin.Forms.

     Get this sample app’s source code from my Github repo, which includes a handful of reusable code snippets to apply in your projects.


Have a question? Find me on twitter or email me nish@xamarin.com


An Introduction to Small Multiples

$
0
0

In my last article I argued that there's still a place for GIFs in data visualization on the web. A GIF can be used to illustrate how a measure or measures have changed over time or vary based on a third, categorical, variable. Small multiples — collections of small (obviously) graphics where the same variables are plotted in each graphic but the data in each graphic are conditioned based on another variable (or two) — can be used for similar purposes, with some advantages and some disadvantages.

Here's the GIF of changes in population over time from my previous article (data comes from the World Bank):

That GIF has 54 separate frames. It's not particularly practical to create a small multiple graphic with 54 separate charts, but we can still get a good idea of the changes taking place by "sampling" the data every six years:

Obviously you can browse the small multiple layout at your leisure. You can clearly see the rapid rise in the population of Mexico, for instance. You can see that the population roughly doubled from just over 50 million in 1972 to a little over 100 million by 2002. To get his kind of information from the GIF you have to keep details in working memory while you wait for the frames to progress.

However, I think the GIF makes more subtle changes more obvious. The "wobbles" (small increases and decreases) in the German population that are easy to see in the GIF are absent from the small multiple graphic. This isn't just because of the lower temporal resolution. Even if there was a graphic for every year, the small size of each graphic and the distance between them would mean the small, subtle, oscillations would likely go unnoticed.

In the article on GIFs I also referenced an earlier chart I created using the same data, a variant on the slopegraph:

Deconstructing this view of the data into separate line charts and then creating a GIF-frame for each country was not particularly useful. But what if we create a small multiple graphic instead? I've done this below, omitting Australia (rather arbitrarily) to facilitate use of a 3 by 4 grid.

This is more useful than the GIF version. It is, for example, much easier to compare countries that aren't spatially adjacent in this graphic than it was to compare countries whose frames weren't temporally adjacent in the GIF. But both seem inferior to the slopegraph variant that allows us to see line crossings (indicating changes in population rank) and more detail in population oscillations (like Germany's) due to the greater vertical extent. However, data for other countries may not match the basic slopegraph design so well. As I've mentioned previously, slopegraphs frequently suffer from issues involving overlapping labels. This isn't an issue with the small multiple set-up.

Another reason the slopegraph variant works well in the previous example is because we have only one line per country, showing population. If we have more than one line per country (or other categorical variable) then this design no longer makes sense. But a small multiple design can excel in such a situation.

The graphic below shows crude birth rateandcrude death rate estimates (again from the World Bank) for a (fairly arbitrary) selection of nine G-20 nations.

From this figure we can see a whole range of interesting (and, unfortunately, frequently sombre and depressing) data stories concerning individual countries, such as:

  • The increase in birth rate and drop in death rate in 1960's China following the end of the Great Leap Forward period;
  • The increase, from the mid-1990's onwards, in the death rate in South Africa due to the AIDS epidemic and the decline in recent years as antiretroviral drugs became more widely available;
  • The hinoeuma year (1966) in Japan.

At the same time, the figure permits us to contrast and compare. For instance, a pattern of low death rates and even lower birth rates leads to an aging population (at least in the absence of any significant migration). Consequently, a quick perusal of the figure and you'd probably not be surprised to learn that recent years have seen concerns over pensions and the retirement age in Italy, Germany and Japan.

Up to now, the examples haven't drawn any distinction between the horizontal and vertical components of a small multiple "grid". But, as with line charts and scatter plots, we can encode different variables in our two different dimensions. The graphic below from NASA's Scientific Visualization Studio (it's well worth downloading the high-resolution TIFF file for yourself) showing the variation in ice extent at the North Pole encodes the year in the horizontal direction (from 1979 to 2014) and the month in the vertical direction. Each column shows how the ice extent changed over the course of the year while each row shows the long term changes for a particular month.

Once again it's important to stress that the choice of chart depends on where it's going to be placed and who is going to see it. Despite each individual chart being small, a small multiple grid can take up considerable space. With small browsers on phones this can be a significant obstacle.

Developer News - What's IN with the Infragistics Community? (8/3-8/9)

$
0
0

From Microsoft to Google, this week's developer news covers every corner of the development world!

5. Google Gave Away a $1 Million Design Guide for Free (Business to Community)

4. What Programming Language Should You Learn? (Boing Boing)

3. How to Change the Connection String of Query in Infragistics Report at Run Time (Nitesh Luharuka)

2. A Developer's Guide to Windows 10 (Microsoft Virtual Academy)

1. ASP.NET MVC 5: Using a Simple Repository Pattern for Performing Database Operations (DotNetCurry)

Why Self-Service Business Intelligence is the Next Big Thing in BI?

$
0
0

The consumerization of IT has had a huge impact on whole areas of computing in the workplace. People now commonly use their personal devices - smart phones, tablets and even watches - to get work done. Their use of the web, social networks and apps has also raised expectations when it comes to enterprise software. People now demand levels of UX, usability and functionality way beyond what was reasonable even a few years ago. In short people want consumer grade tools and experiences in the workplace.

The next area to feel the impact of these trends is business intelligence, specifically the area of “self-service”.

What is self-service business intelligence?

Self-service business intelligence is essentially business intelligence without the IT department. It is the ability to deliver actionable insights, without the need to instigate a complex technical project, custom software, or teams of developers. It is the ability for business users themselves to get involved in solving their own problems, in building and delivering their own dashboards and insights. It is a freedom for all concerned to do more, and it is a really powerful proposition.

ReportPlus from Infragistics

Our own ReportPlus mobile app, for iOS and Android, is an excellent example of how good self-service BI can be realized. You can find out more about the tool here, but let’s look at a practical example:

Darren is a sales manager for a large marketing agency. He travels the country talking to potential clients about how the campaigns, reports and research his company produces can help them get ahead of their competitors. He often talks about ‘ROI’ and ‘Competitive Advantage’ in his meetings, but he understands the power of showing clients real demos.

He used to work with his IT department to build demos in advance of each sales meeting. He’d do a little research on the company in advance, put together a lot of mock data that he thought was useful. IT would then use some business intelligence tools to put together interesting reports and dashboards. When the process worked, it worked well, but there were a number of issues:

  • Getting the data, in advance of talking to the company was hard. It often resulted in Darren making it up. This meant it wasn’t always realistic.

  • IT need to build the dashboards, they used SQL Server to store the data and generated dashboards in HTML and CSS. This took time and planning. Darren, being in Sales, needs to be reactive. IT didn’t always keep up.

  • The technology needed supporting. Darren sometimes got to meetings and couldn’t access the demo. IT often turned off servers without telling him, or accessing them remotely proved complex.


This all changed when Darren got ReportPlus. Suddenly self-service BI was an option for him. His Sales prep and presentations where now radically different:

  • He did little prep, other than ensure he had created some relevant dashboard, in which he could pull in the customer’s data.

  • When he arrived at the meeting he asked if it was possible to login to a SharePoint system, a HR tool, Google Analytics, or some other such data source.

  • In his meeting he simply plugged this data in ReportPlus, used some dashboards he’d prepared and showed his potential clients how they could benefit from the insights he was selling.

Suddenly Darren didn’t need to reply on IT, complex BI software he couldn’t access directly, or conditions out of his control. He could do it all himself. Darren was using his own self service BI solution, and getting real wins out of it.

What next for the IT department?

It is a myth that self-service IT means the end of the traditional IT department. Rather than being seen as a negative development, trends like BI are actually huge opportunities for these technical groups to focus on other more rewarding tasks. Rather than being tied up in end user configuration and support, they can focus on backend architecture and configuration. Within the area of BI there's still plenty of work needing to be done, things like setting up data warehouses and databases. Essentially they can get back to what they are best at.

Self-service business intelligence is actually a win win for people across an entire organization. End users get to contribute in the most positive ways to solving the very problems that affect them. IT departments and teams can focus on other areas where they can deliver value. And those at the top of an organization realize the resource and financial efficiencies that can help make them more competitive in the marketplace. 

What is a prototype?

$
0
0

When it comes to designing a great interface for an app, website or other tool, User Experience (UX) should be at the center of everything you do. But how do you know if your navigation, display and page organization offer a smooth and easy to use experience? Naturally, designers know their designs inside out, but do they make any sense to end users? Prototypes offer the middle ground here, providing a way of gauging the effectiveness of your design.


Prototypes help developers and designers explore their ideas before they write a line of code, allowing them to test these with stakeholders and their target audience. Prototypes allow you to:


  • Experience the content and interactions of an interface


  • Learn how the product may feel in the hands of the user


  • Get a cost-effective method of understanding and developing your product


No developer wants to spend hours meticulously editing their code and building a product just for it to get sent back to the drawing board because of an unforeseen usability error.


The static nature of wireframing and visual mockups offers a useful way of understanding how a user interface may look on screen, but there will always be question marks until you can physically interact with what you’ve created. Prototyping allows this, without taking up precious time and often without having to write a single line of code.


In this post we will look at what prototypes are and what they are not.


Prototype styles


A step-by-step or iterative development process allows for consistent testing of the feasibility and usability of a product. This offers a great way for discovering which areas might need some tweaking, especially given how much has to be considered when creating an effective UX. Prototyping allows for multiple iterations at any level of fidelity to be made in a relatively short space of time.  


There are two different ways of to approach prototyping: Paper and Click-through


  • Paper prototyping gives you the ability to transfer straight from your initial design to pen and paper sketches, meaning the only limit to creativity is your imagination
  • Click-through prototypes are a little more complicated and let you design a range of screens using a computer based prototyping platform. While more time consuming, click through prototypes give you the benefits of interactivity


Paper prototyping allows you to make constant improvements and alterations easily, while click-through offers a more accurate representation of the finished product. Of course, you are not limited to just one of these methods, and trying out both will let you see which is best suited for you and your product.


It’s also worth deciding on the fidelity of your prototype - low-fidelity, high-fidelity, or somewhere in between. High-fidelity lets you focus on perfecting the visual design, whereas low-fidelity takes less time and effort to build, and as such is more suited to practicing the interaction flows and general feel of your product.


Prototype faster than ever


Thanks to the consumerization of IT, clients expect high quality experiences to be delivered rapidly, often without understanding just how complicated it is to build an app. Time is precious and budgets are often tight. Prototypes aim to give you a good idea of how smoothly your product looks and feels without having to tear your hair out over all the improvements you need to make along the way. However, in today’s market customers expect things faster, better and at a lower cost than ever before. Indigo Studio lets you create prototypes without writing a single line of code and gets you closer to that final product so much faster.


With an unparalleled focus on UX, and a new online share feature which allows colleagues to test and explore your designs without having to open Indigo Studio, letting you work collaboratively with ease. Indigo Studio provides smooth screen-to-screen animations that support touch gestures and the ability to design native experiences for iPhone and iPad with the iOS Platform Pack.


It is always worth remembering that a prototype is never the finished product. There will always be dissimilarities between the prototype and your final product in terms of look and feel. That said, there is no doubt that when it does come to release, prototyping will have given you a more accurate and complete idea of what your product is there to do and who it’s for. Now all that’s left to do is go out there and get creative.

Viewing all 2372 articles
Browse latest View live


Latest Images